
Self-Storage REIT Highlights
- Pricing and Rate Stabilization: CubeSmart reported new customer rates down 10.3% year-over-year in Q4, improving to a 7.4% decline by February 2025, with further improvement expected heading into the peak leasing season.
- Occupancy Trends: Same-store occupancy ended 2024 down 100 basis points year-over-year, recovering from a wider gap earlier in the year as pricing flexibility and targeted promotions helped offset demand softness.
- Strategic Acquisitions: CubeSmart acquired its partner’s 80% stake in a 14-property Dallas portfolio, representing $452.8 million of investment, strengthening its presence in a high-growth metro despite near-term rate pressure.
- Leasing and Rate Trends: Extra Space saw new customer rates decline 6% year-over-year by the end of Q4, improving from a 9% decline in Q3, supported by strong marketing conversion and targeted rate adjustments in higher-barrier markets.
- Occupancy Leadership: Same-store occupancy finished the year at 93.7%, up 70 basis points year-over-year, giving Extra Space the highest occupancy rate among its peers following its successful integration of Life Storage.
- Capital Deployment: Extra Space deployed $950 million into acquisitions, joint ventures, and bridge loans in 2024, including $610 million in Q4 alone, while expanding its third-party management platform by over 600 stores for the year.
- Revenue and Occupancy Recovery: NSA reported same-store rental revenue down 4.47% year-over-year, reflecting heavy pricing competition in secondary markets, but occupancy stabilized to down 160 basis points, recovering from an initial 270 basis point gap at the start of the year.
- Portfolio Optimization: NSA sold 49 non-core properties for $270 million, redeploying capital into $65 million of new acquisitions and $150 million in joint venture investments, targeting higher-growth submarkets with improving supply-demand balance.
- Operational Consolidation: 2024 marked the completion of NSA’s internalization of its PRO structure, consolidating operations under a unified platform and creating operational efficiencies that position the REIT for enhanced profitability as market conditions improve.
- Operational Performance: Public Storage ended 2024 with same-store revenue declining by 0.6% year-over-year, though sequential improvement in Q4 marked the first quarterly revenue acceleration in more than two years, demonstrating stabilizing fundamentals in core markets.
- Occupancy and Cost Control: Same-store occupancy held at 90.5%, while on-site labor hours were reduced by 30% through expanded use of AI-powered staffing models and remote management technologies.
- External Growth: Public Storage completed $221 million in acquisitions during Q4, primarily targeting urban infill locations where supply pipelines are shrinking, positioning the company for future rent recovery and value growth.
Thoughts from the CEO's
CubeSmart
Christopher P. Marr
President & Chief Executive Officer
- “We believe that for our portfolio, the fourth quarter of 2024 may have marked an inflection point in the trend of decelerating same-store revenue growth that we and the industry have been experiencing since reaching the COVID induced peak in the second quarter of 2022. From their trough in November of last year, our year-over-year growth in same-store revenues has begun to slowly improve“
Extra Space Storage
Joseph D. Margolis
Chief Executive Officer
- “We were able to maintain industry-leading occupancy and generate modest same-store revenue growth despite an environment marked by new customer price sensitivity. Outsized non-controllable expenses, particularly real estate taxes, were a headwind leading to modestly negative same-store NOI. Yet we were able to offset this through strong growth in our other storage-focused business lines of tenant insurance, bridge lending, and third-party management, allowing us to generate positive year-over-year FFO growth.”
National Storage Affiliates
David Cramer
President & Chief Executive Officer
- “Although the current operating conditions remain challenging due to elevated supply and muted transitory demand from historically low home sales, the medium-term outlook for the self-storage sector and NSA in particular is that the best it’s been in the past few years.”
Public Storage
Joseph D. Russell, Jr
President, Chief Executive Officer
- “We ended 2024 on a positive note with results that reflected the stabilization we are driving across our business. We began 2024 by pointing out that a handful of markets were improving sequentially and that we expected more would follow suit. They did, and we ended the year with nearly all markets having inflected, and we are seeing broad operational stabilization.”
Macroeconomic Highlights
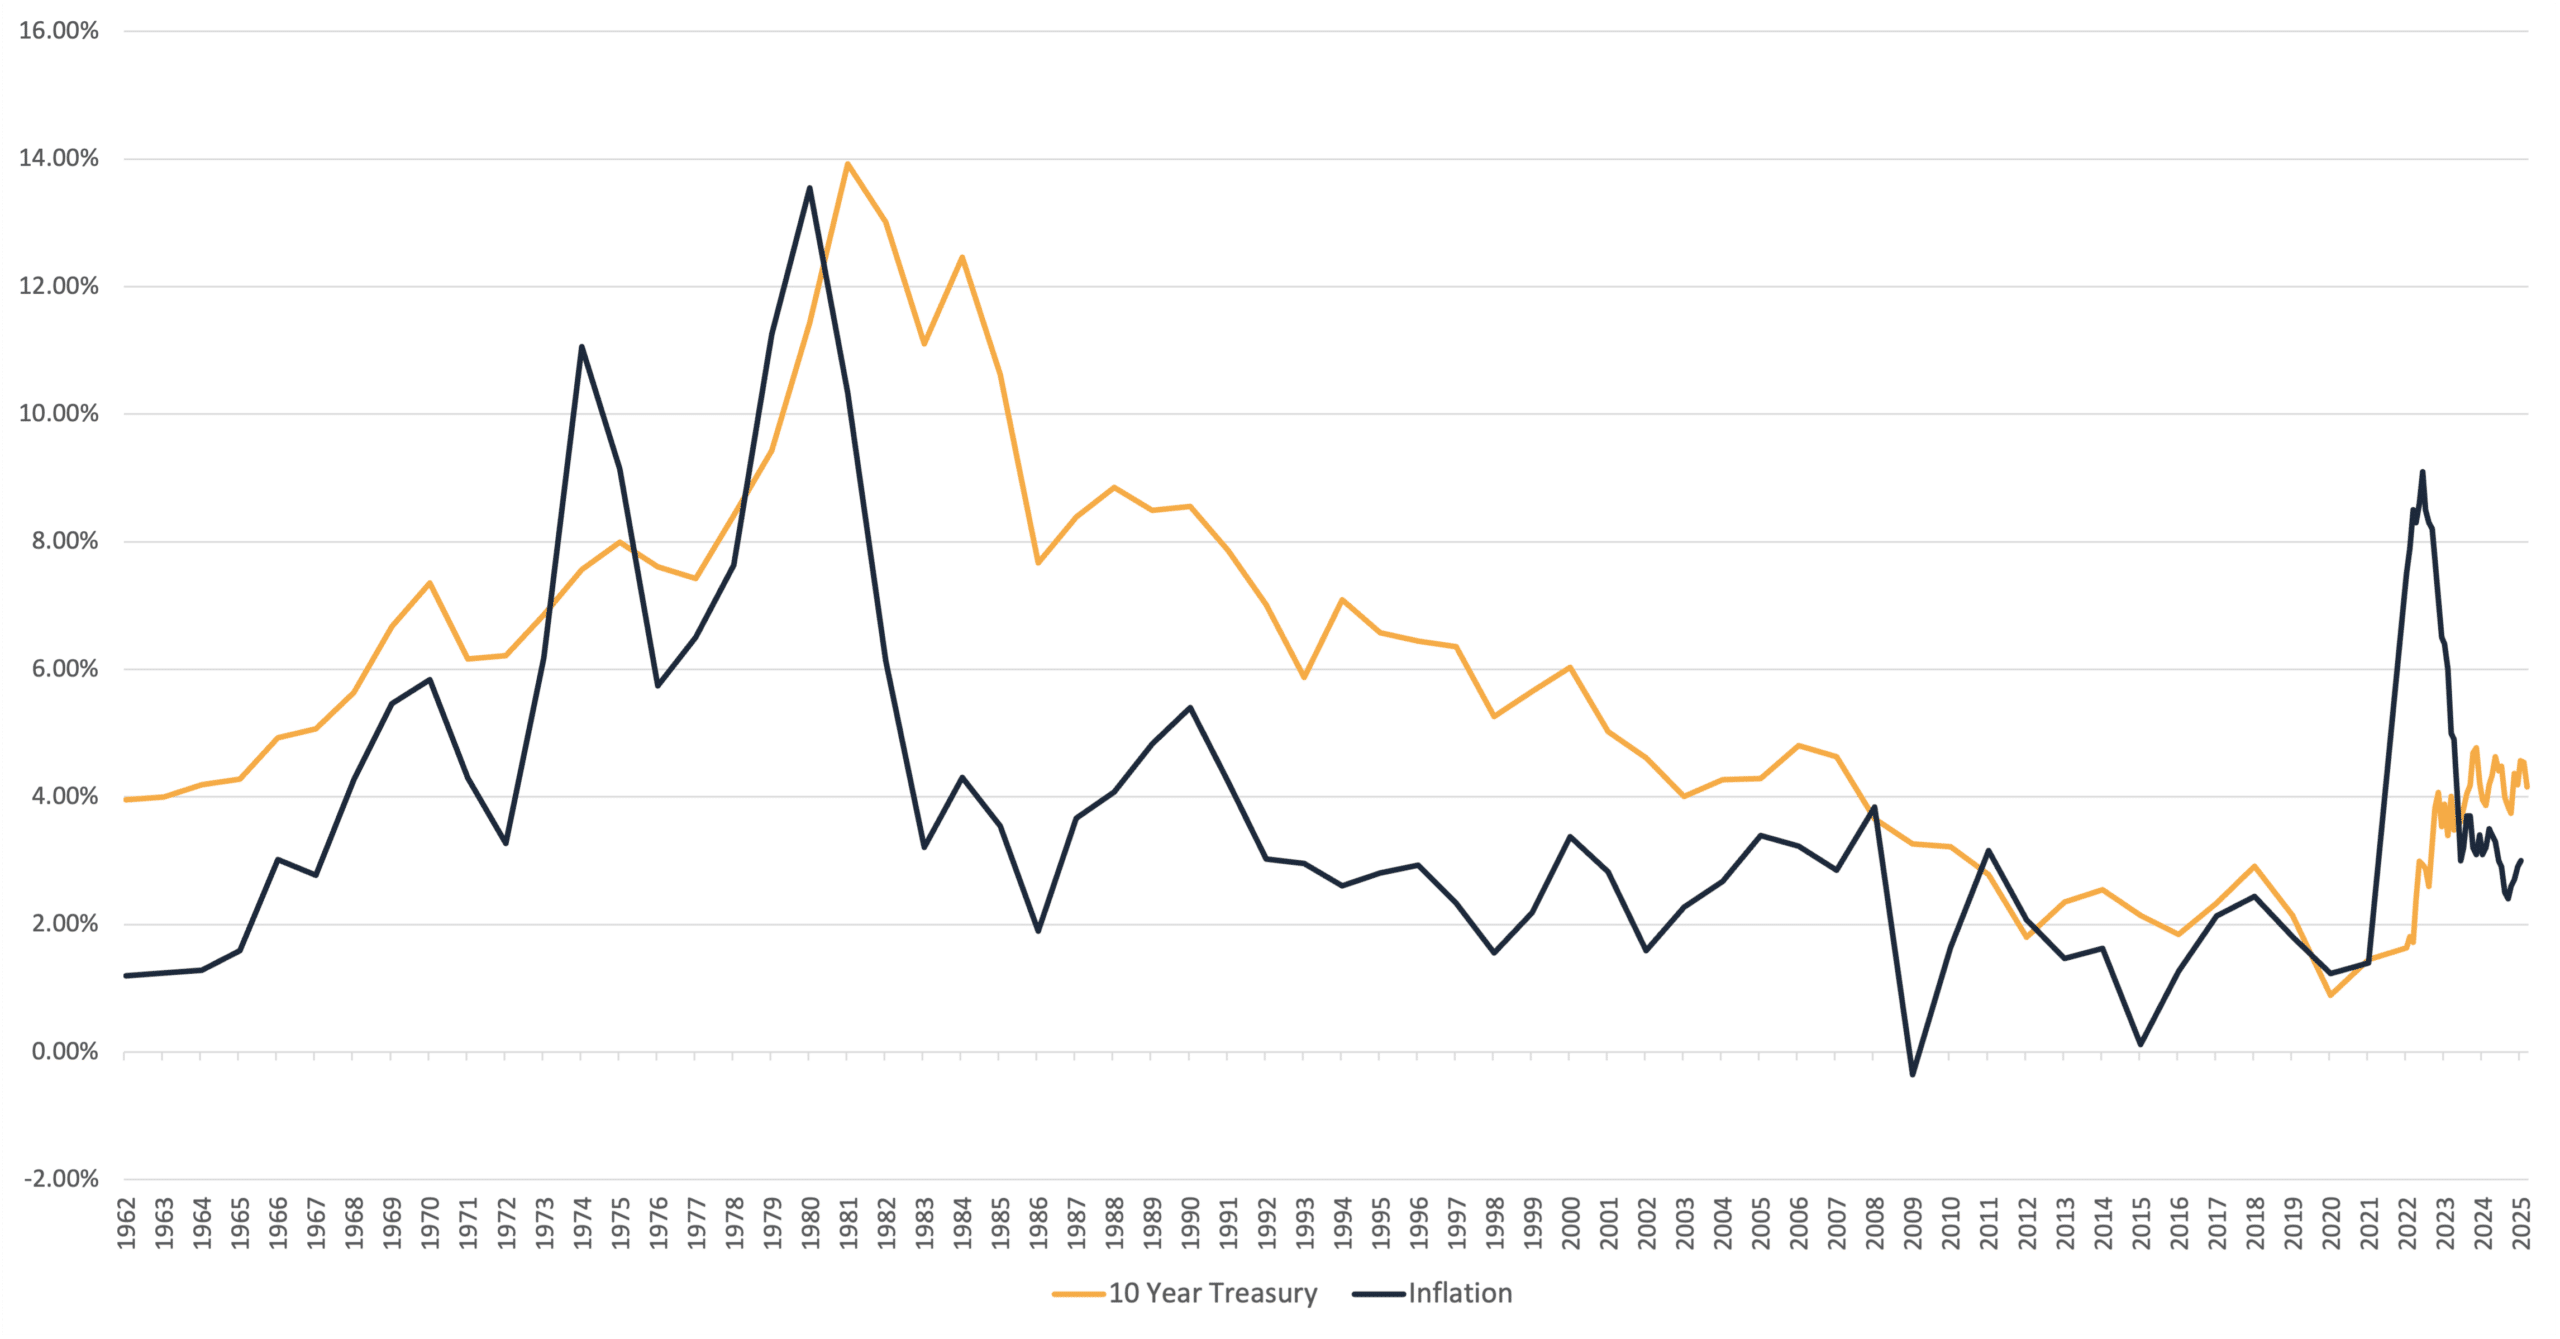
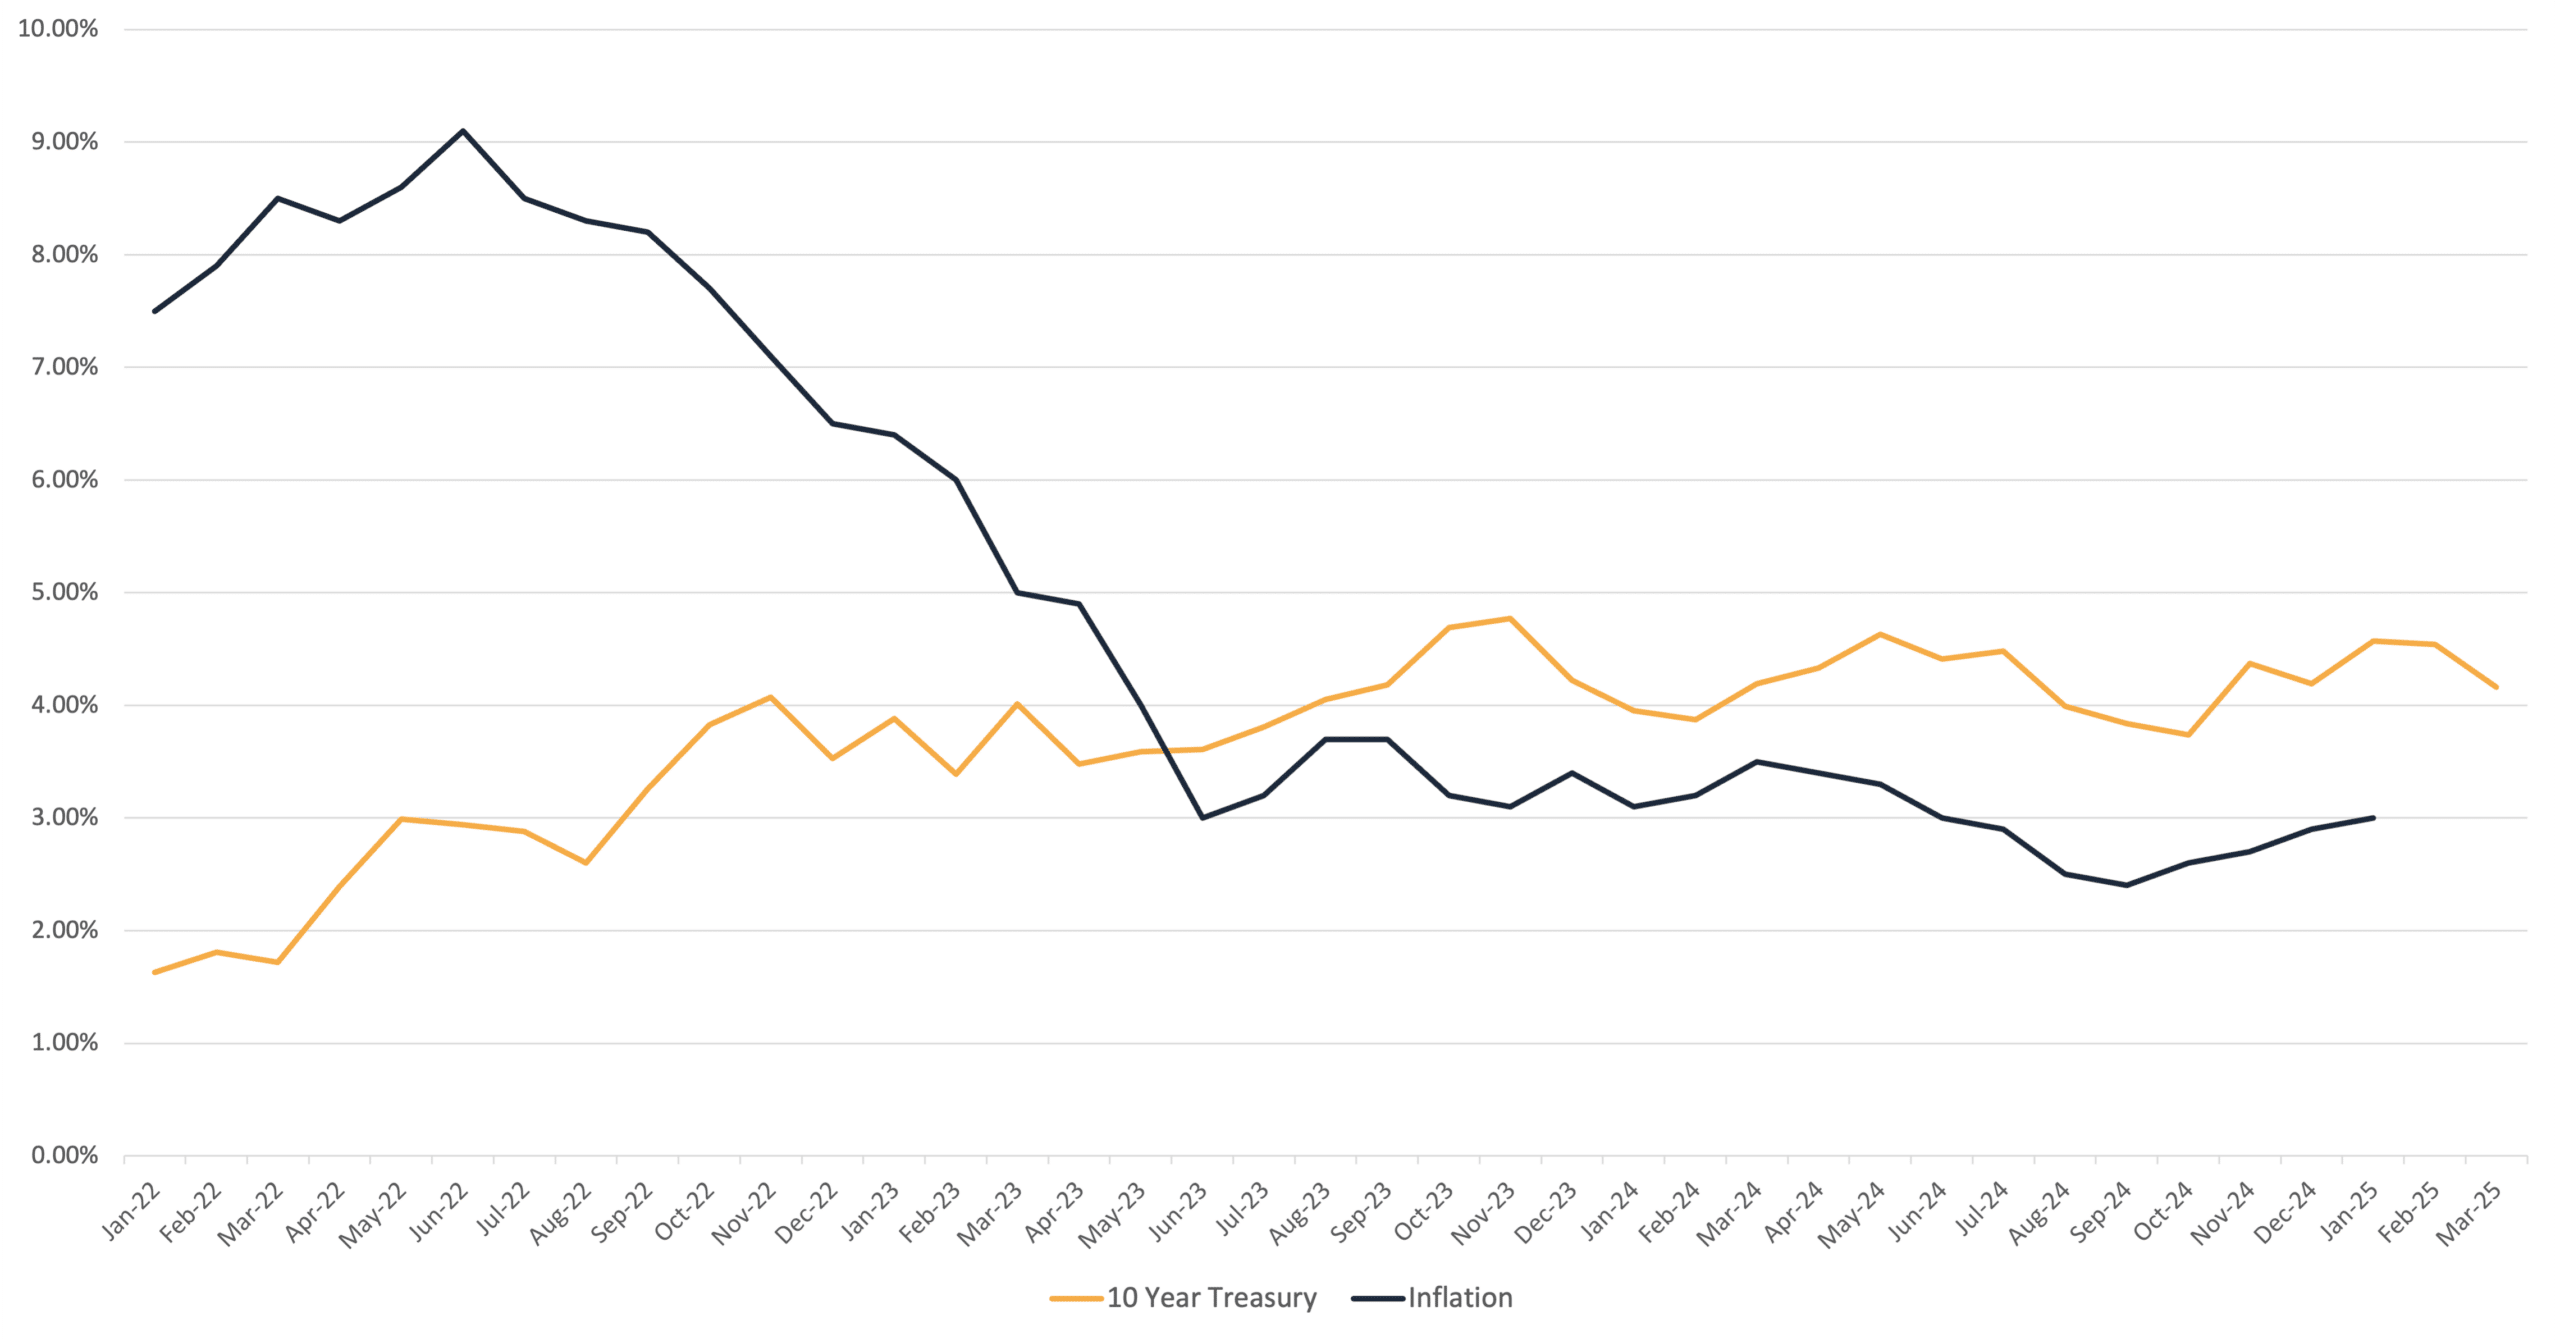
Interest Rates and Economic Slowdown: Economic uncertainty continues to weigh on the commercial real estate sector as the Federal Reserve’s higher-for-longer rate stance shapes capital markets and borrowing decisions. GDP growth slowed to an annualized rate of approximately 1.9% in Q4, down from stronger expansion earlier in the year, as elevated borrowing costs restricted consumer spending, home sales, and business investment. While inflation moderated to around 3%, the Fed emphasized that persistent cost pressures in services, insurance, and labor-intensive industries could delay rate cuts until the second half of 2025. For real estate, particularly sectors reliant on housing turnover or discretionary consumer spending, this environment limits pricing power and keeps transaction volume subdued until financing conditions ease.
Capital Markets and Post-Election Policy Shifts: Following the 2024 presidential election, attention has shifted to new fiscal priorities and their implications for commercial real estate investment. Early policy signals suggest a focus on healthcare spending reforms, renewed climate resilience programs, and potential adjustments to corporate tax rates, all of which will impact investor underwriting for assets. In addition, tightening global credit conditions and slower cross-border investment flows have reduced liquidity for larger transactions, reinforcing a flight to quality, where institutional investors prefer core assets in proven markets. For self-storage and medical office, this favors high-barrier, infill locations with strong demand drivers, while pricing uncertainty persists for secondary and tertiary markets where capital access remains constrained.
Inflation and the 10-Year Treasury Since 1962
Inflation and the 10-Year Treasury Since 2022
Q4 2024 Self-Storage REIT Data Overview
| Same Store Ending Occupancy | Same Store YoY Revenue Increase | Same Store YoY Expense Increase | Same Store YoY NOI Increase | Same Store Achieved Rate | Q4 Acquisitions | ||||||||
| 2024 | 2023 | 2024 | 2023 | 2024 | 2023 | 2024 | 2023 | 2024 | 2023 | % Change | 2024 | 2023 | |
| CUBE | 89.30% | 90.30% | -2.20% | 0.50% | 4.70% | -1.80% | -3.70% | 1.20% | $23.86 | $24.00 | -0.6% | 16 | 1 |
| EXR | 93.70% | 93.00% | -0.20% | 0.70% | 9.50% | 4.00% | -3.50% | -0.10% | $21.63 | $22.88 | -5.5% | 38 | 7 |
| NSA | 84.40% | 86.00% | -4.47% | -0.50% | 4.70% | 4.80% | -7.50% | -1.60% | $15.56 | $16.05 | -3.1% | 4 | 2 |
| PSA | 90.50% | 91.60% | -0.60% | 0.60% | 1.30% | 8.20% | -1.00% | -1.00% | $22.89 | $23.04 | -0.7% | 17 | 11 |
Q4 2024 Self-Storage Operating Fundamentals
Self-Storage Rental Rates
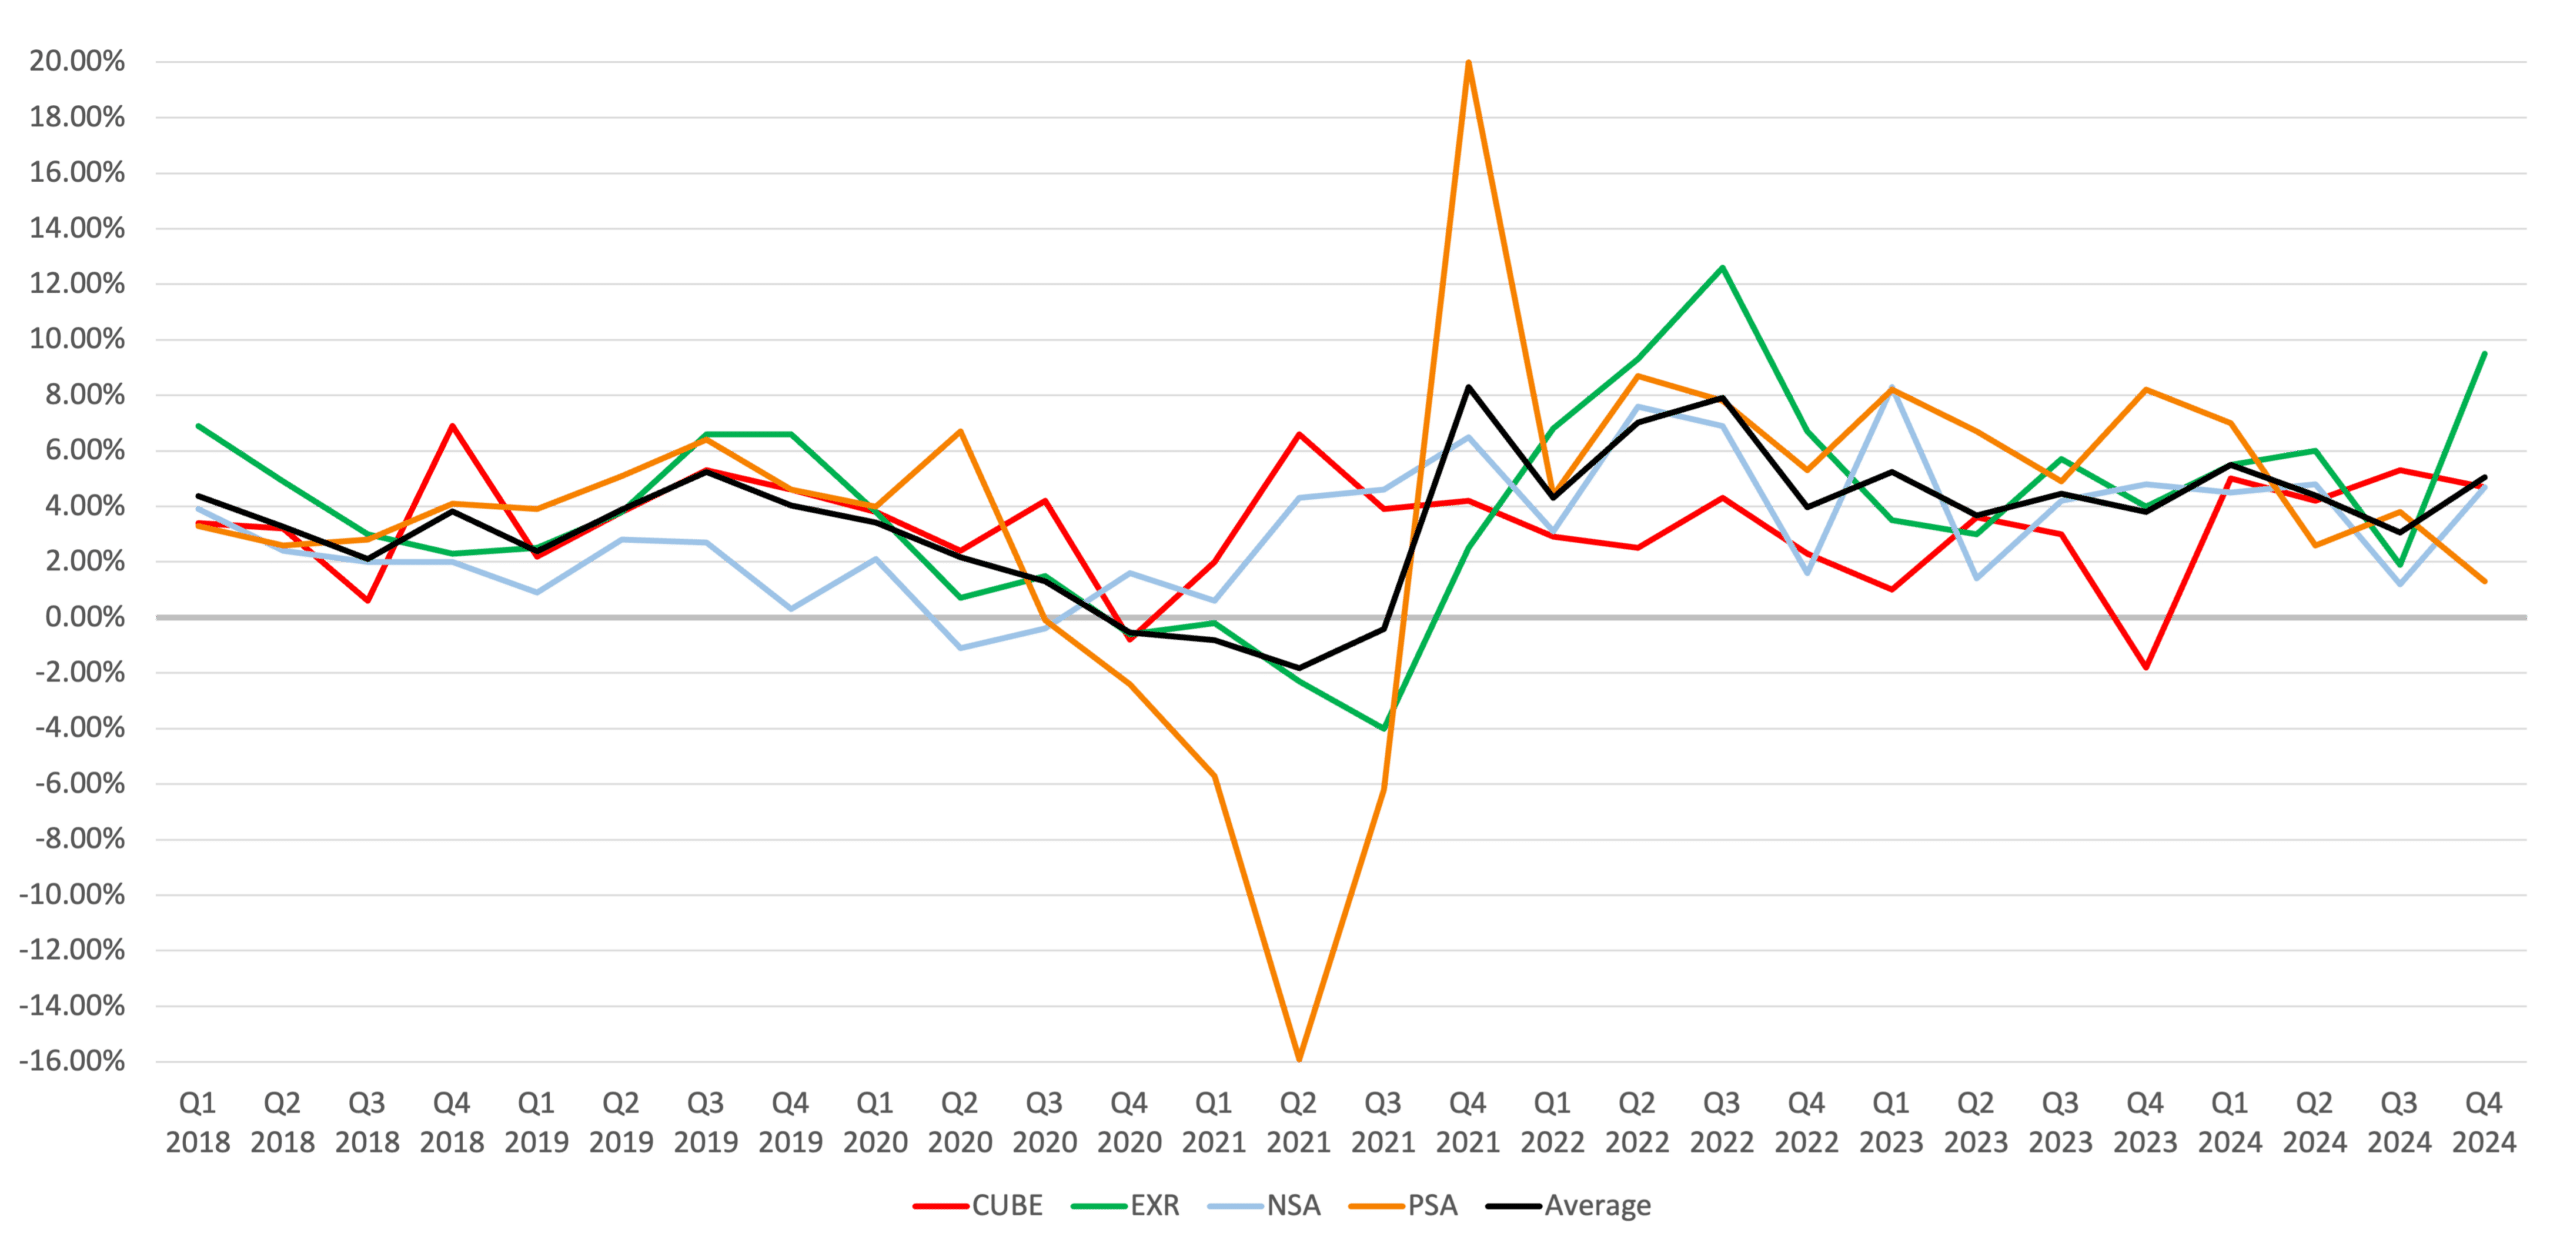
Same-store revenue growth was negative across all major self-storage REITs in 2024, reflecting the combined drag from lower move-in rates, reduced ECRI pacing, and modest occupancy softening. Public Storage reported that same-store rental revenue fell by 0.6% in Q4. Extra Space Storage experienced a decline of 0.4% in same-store revenue for the same period. CubeSmart saw a drop of 1.6% in same-store revenue in Q4. National Storage Affiliates (NSA) reported the sharpest decline at 4.3%, attributable to its heavier exposure to supply-challenged secondary markets.
Expenses grew substantially faster than revenue, leading to widespread NOI compression. CubeSmart’s property taxes surged by 17.5% year-over-year in Q4. Extra Space Storage saw same-store expenses rise by 9.5%, driven by property tax increases in Georgia and Illinois. NSA’s expenses increased by 4.7%, primarily due to higher marketing, utilities, and insurance premiums.
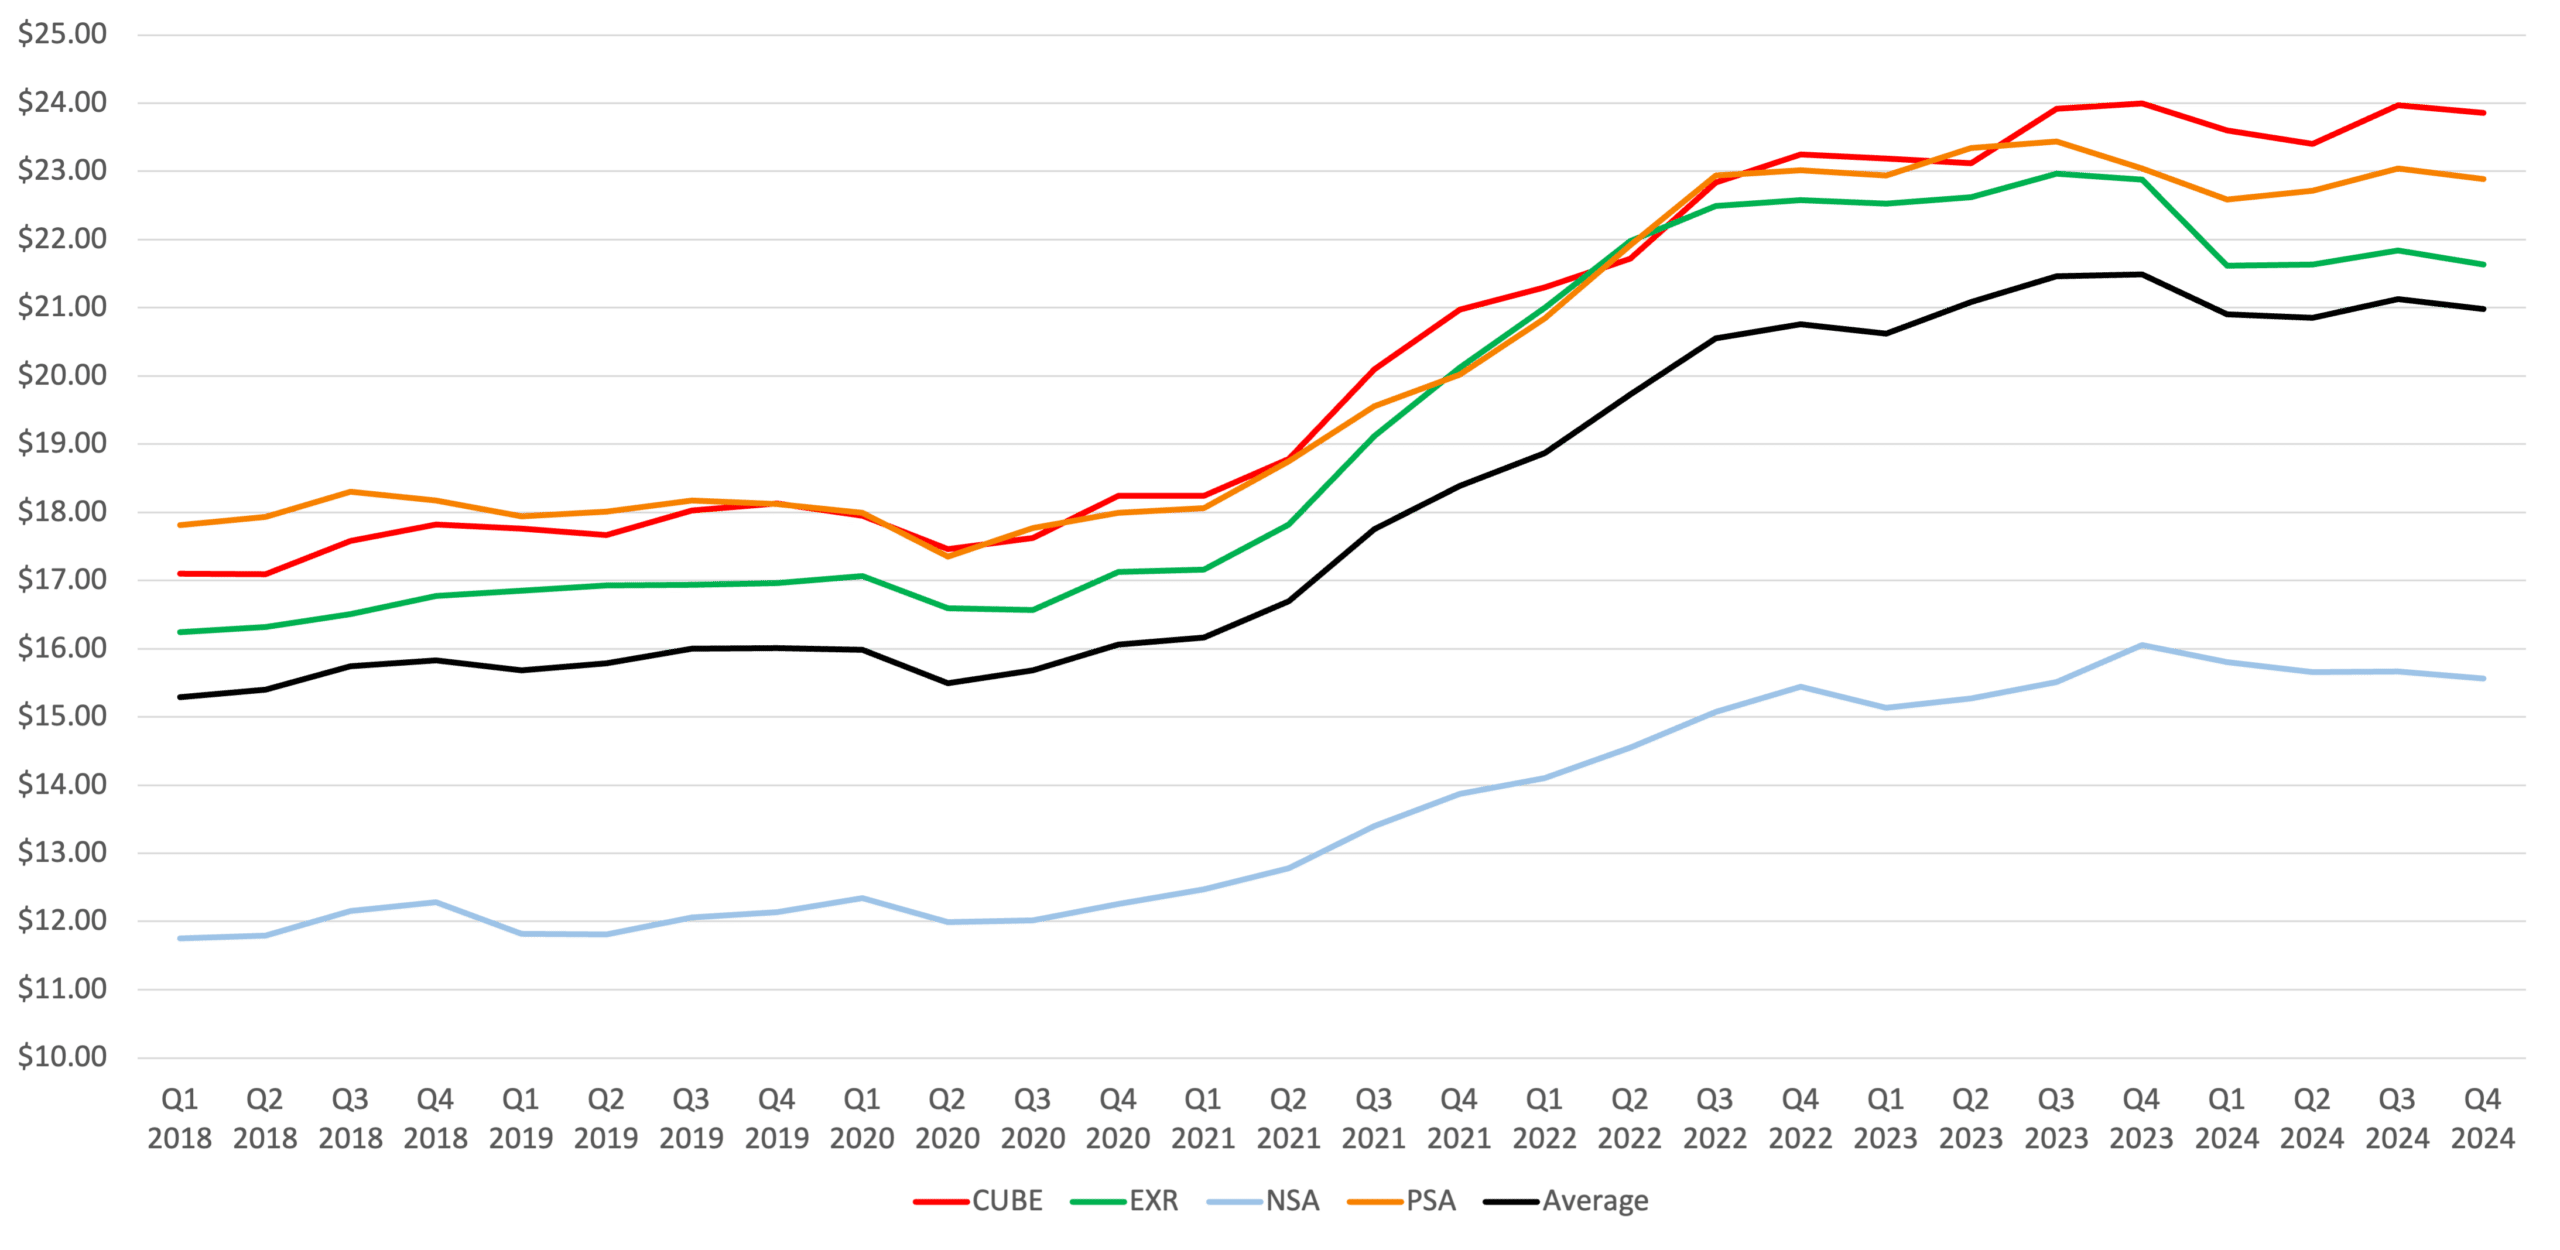
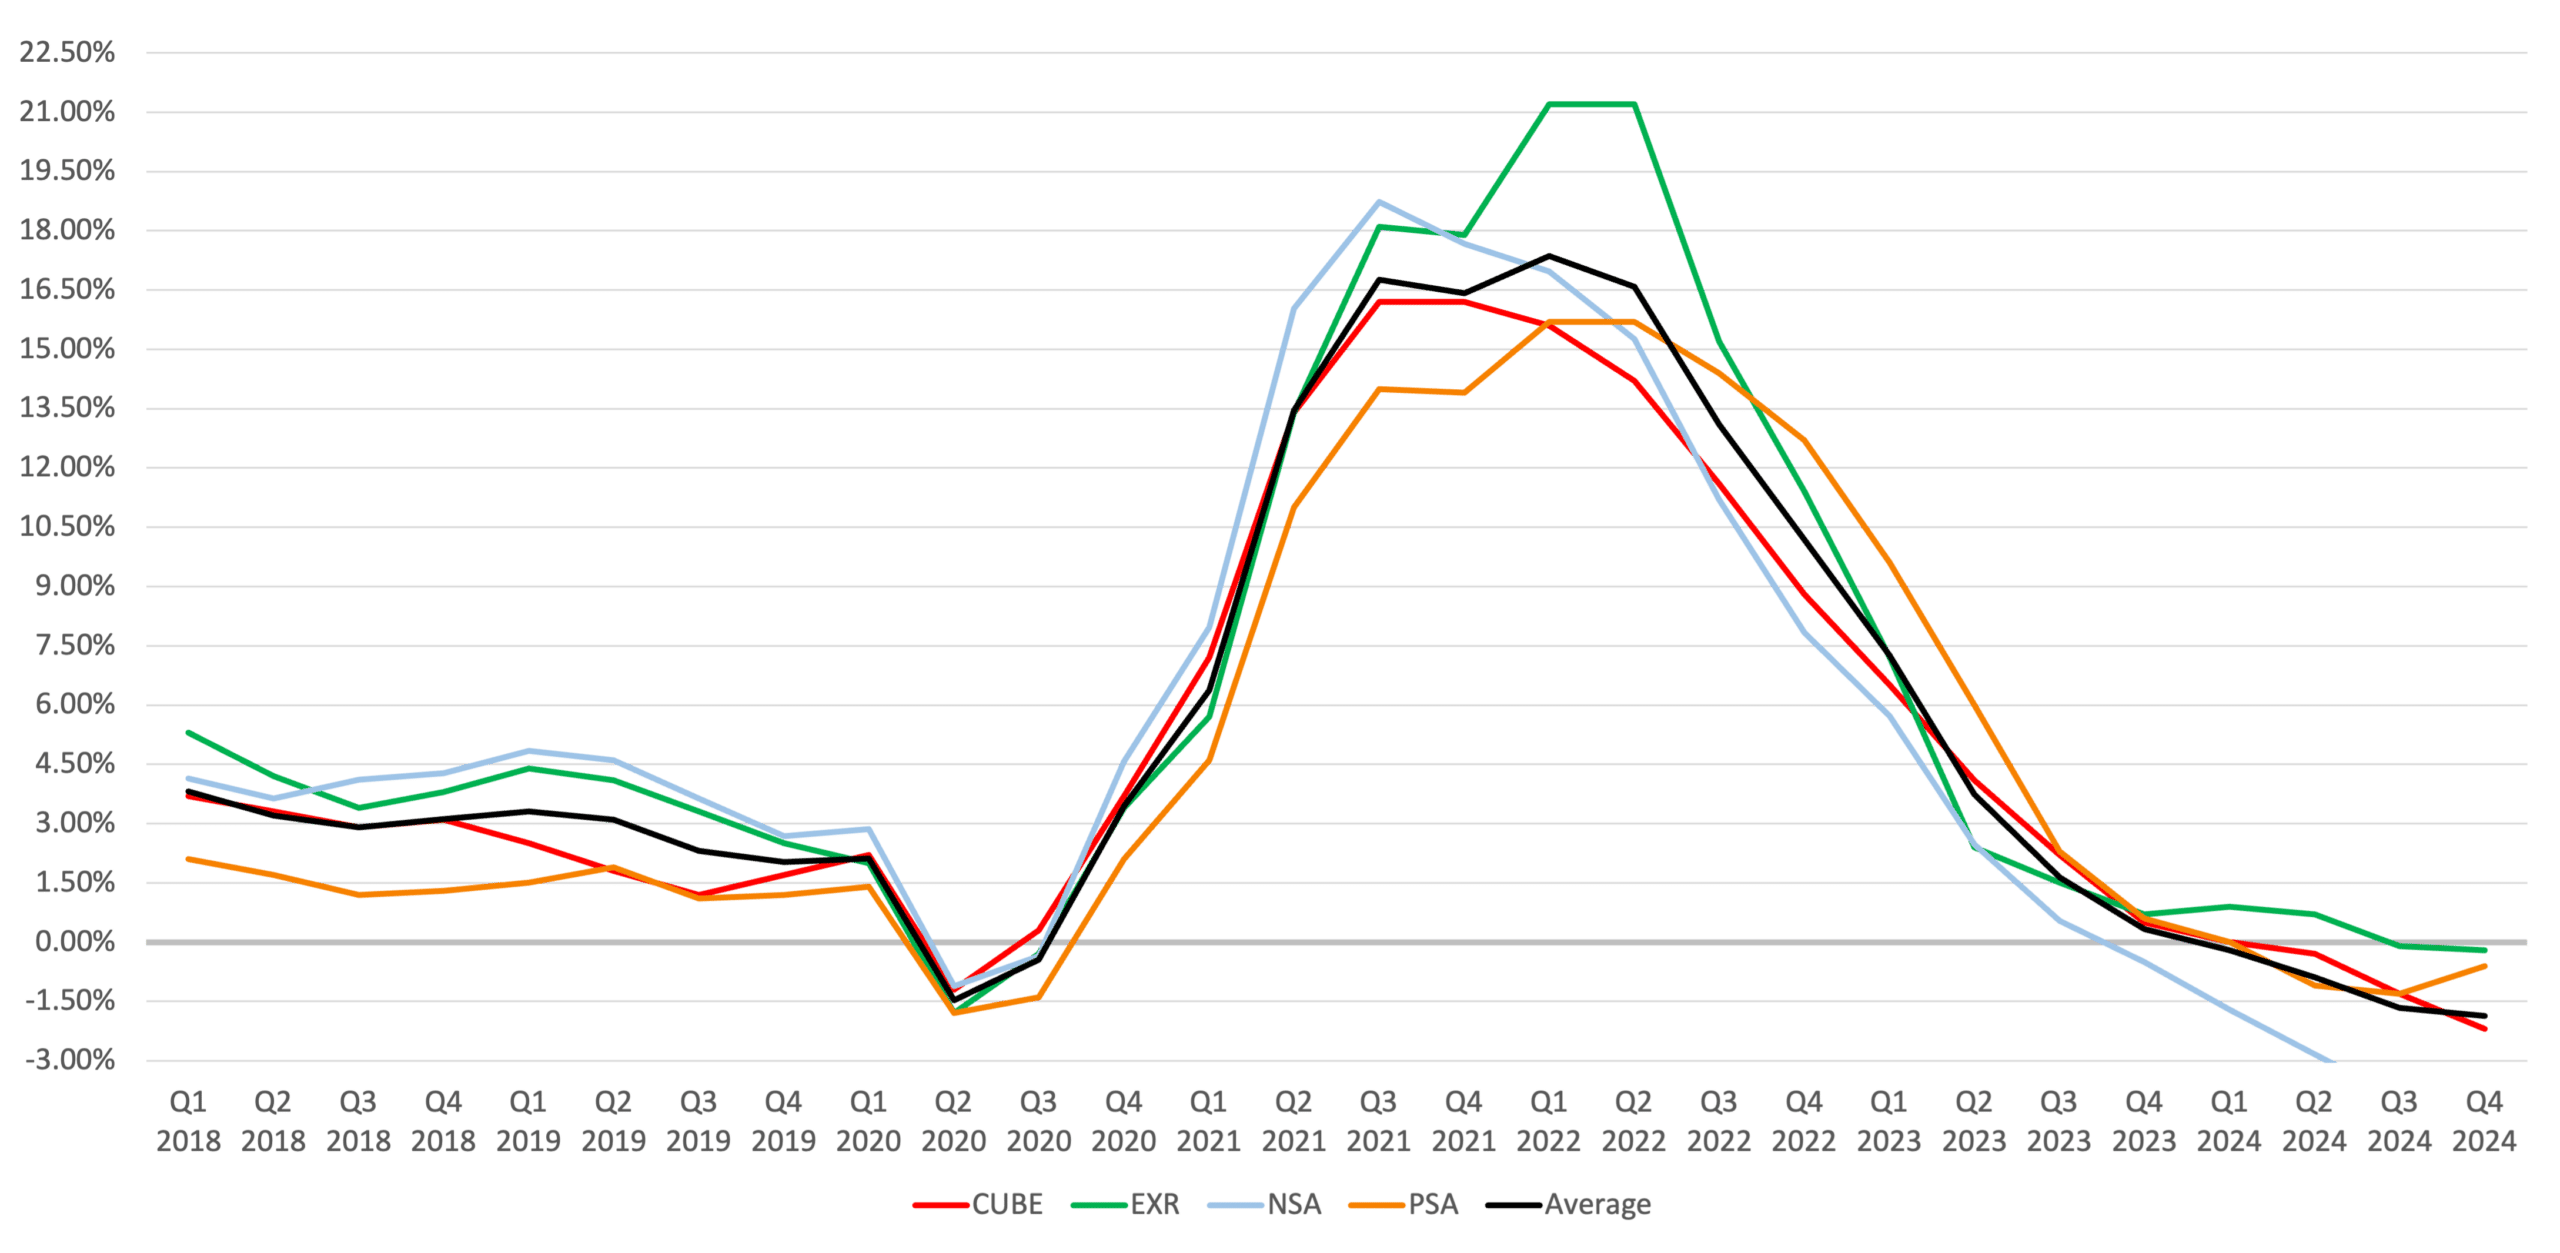
Achieved Rates (Same Store)
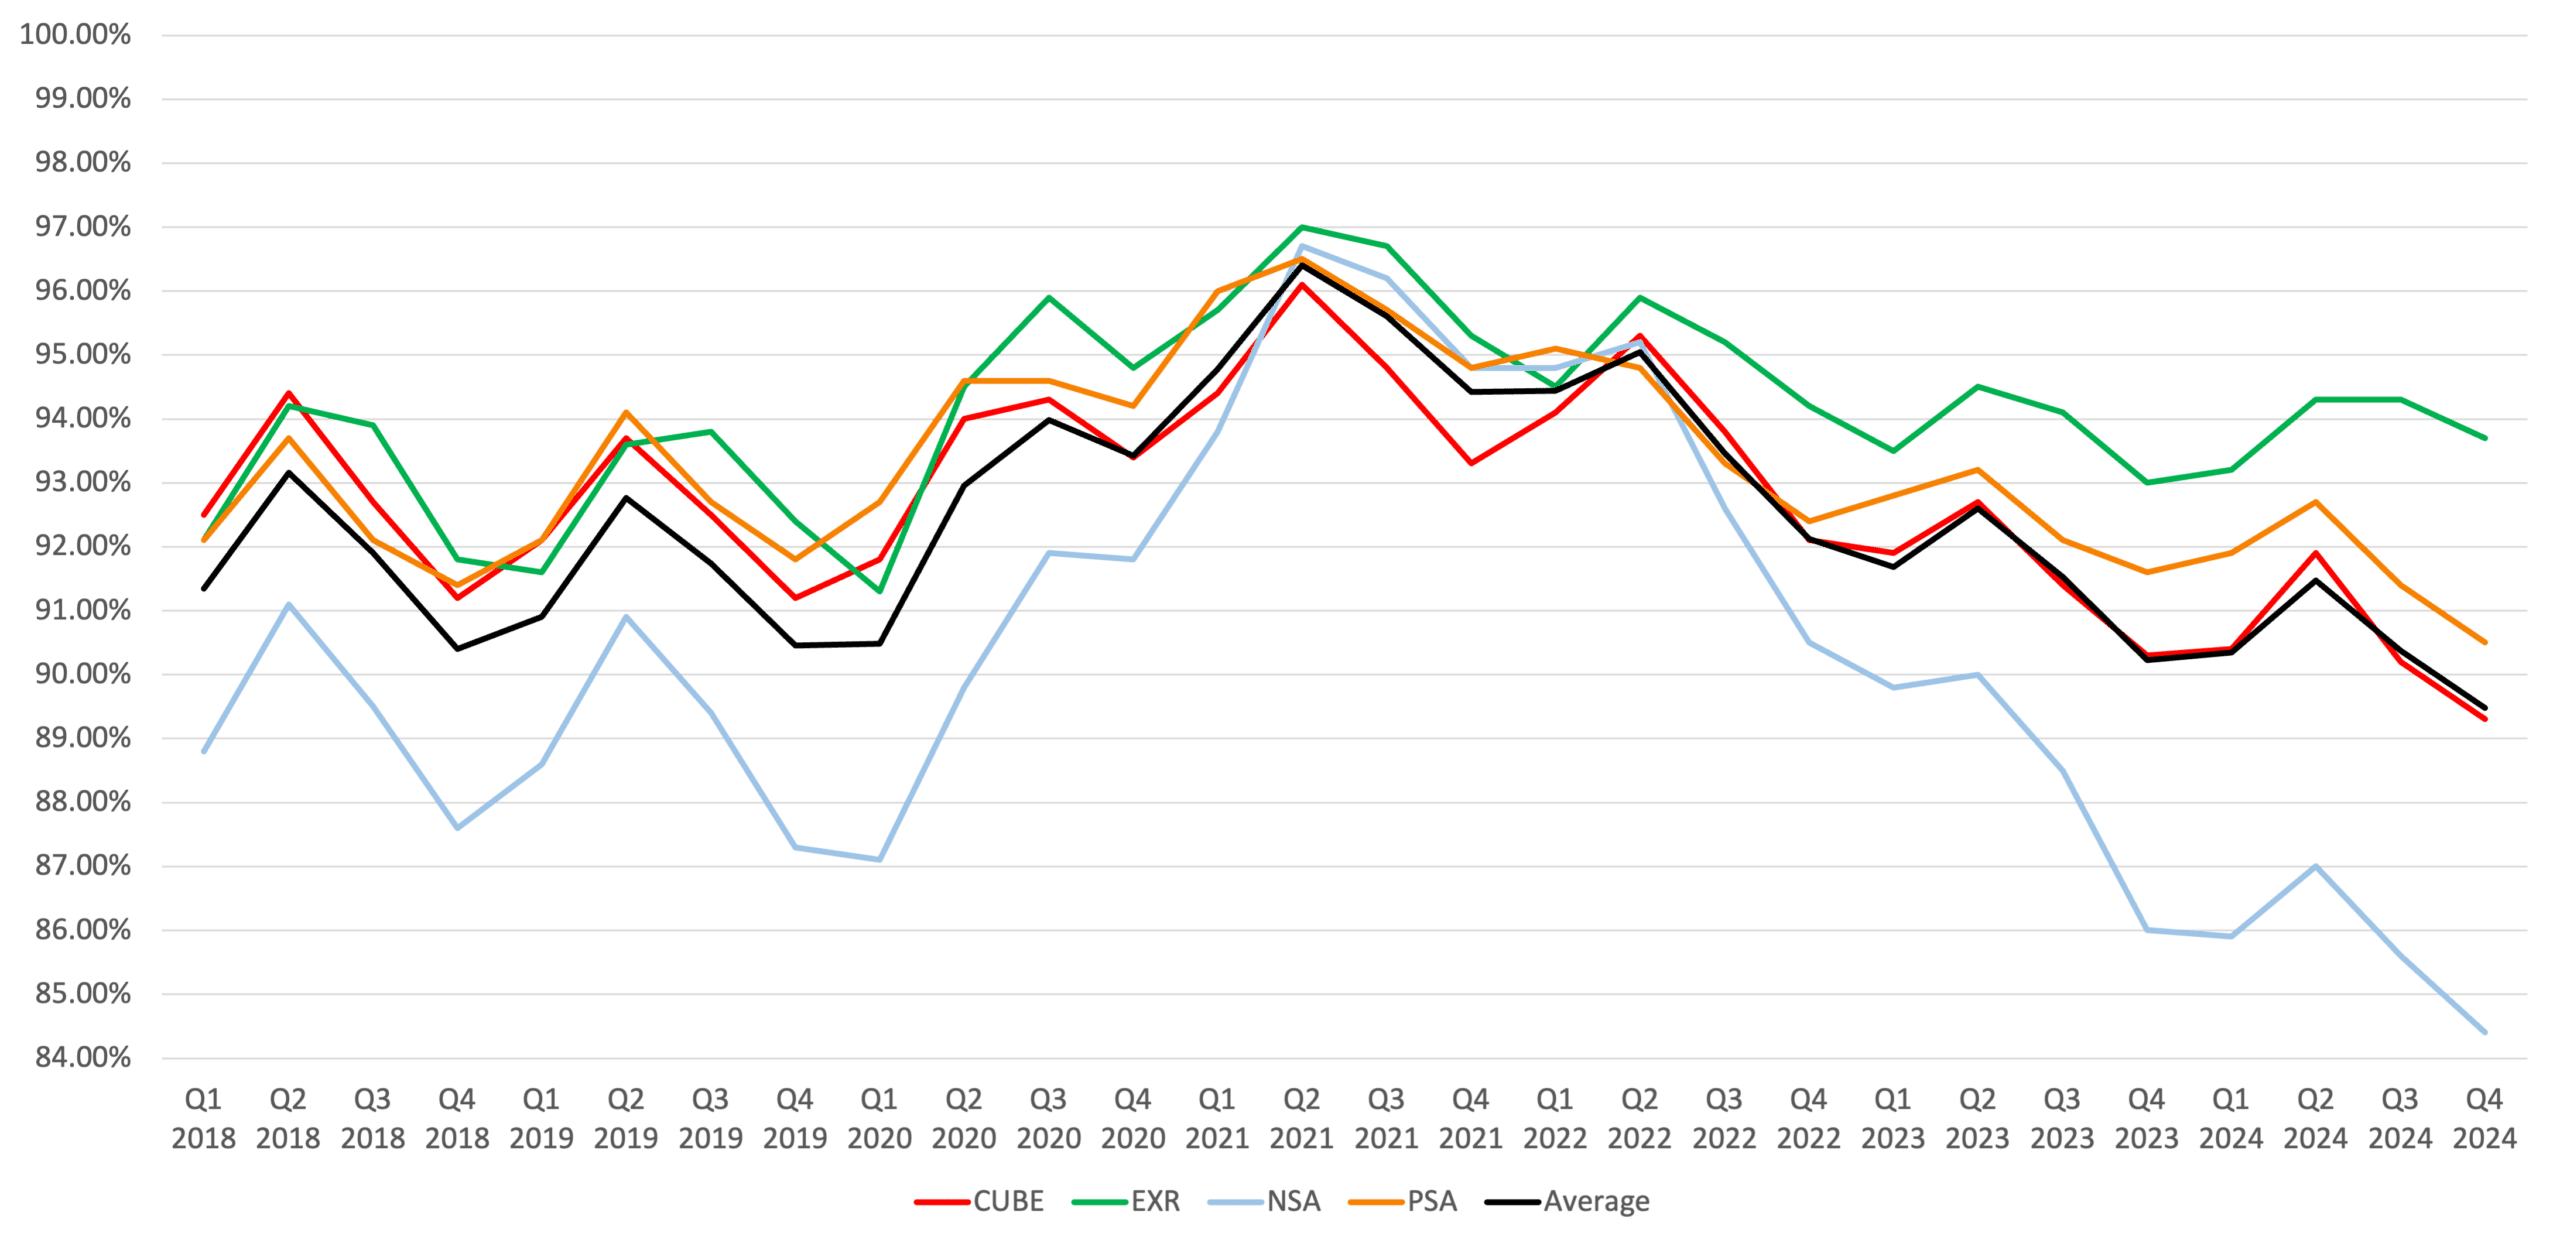
Self-Storage Occupancy
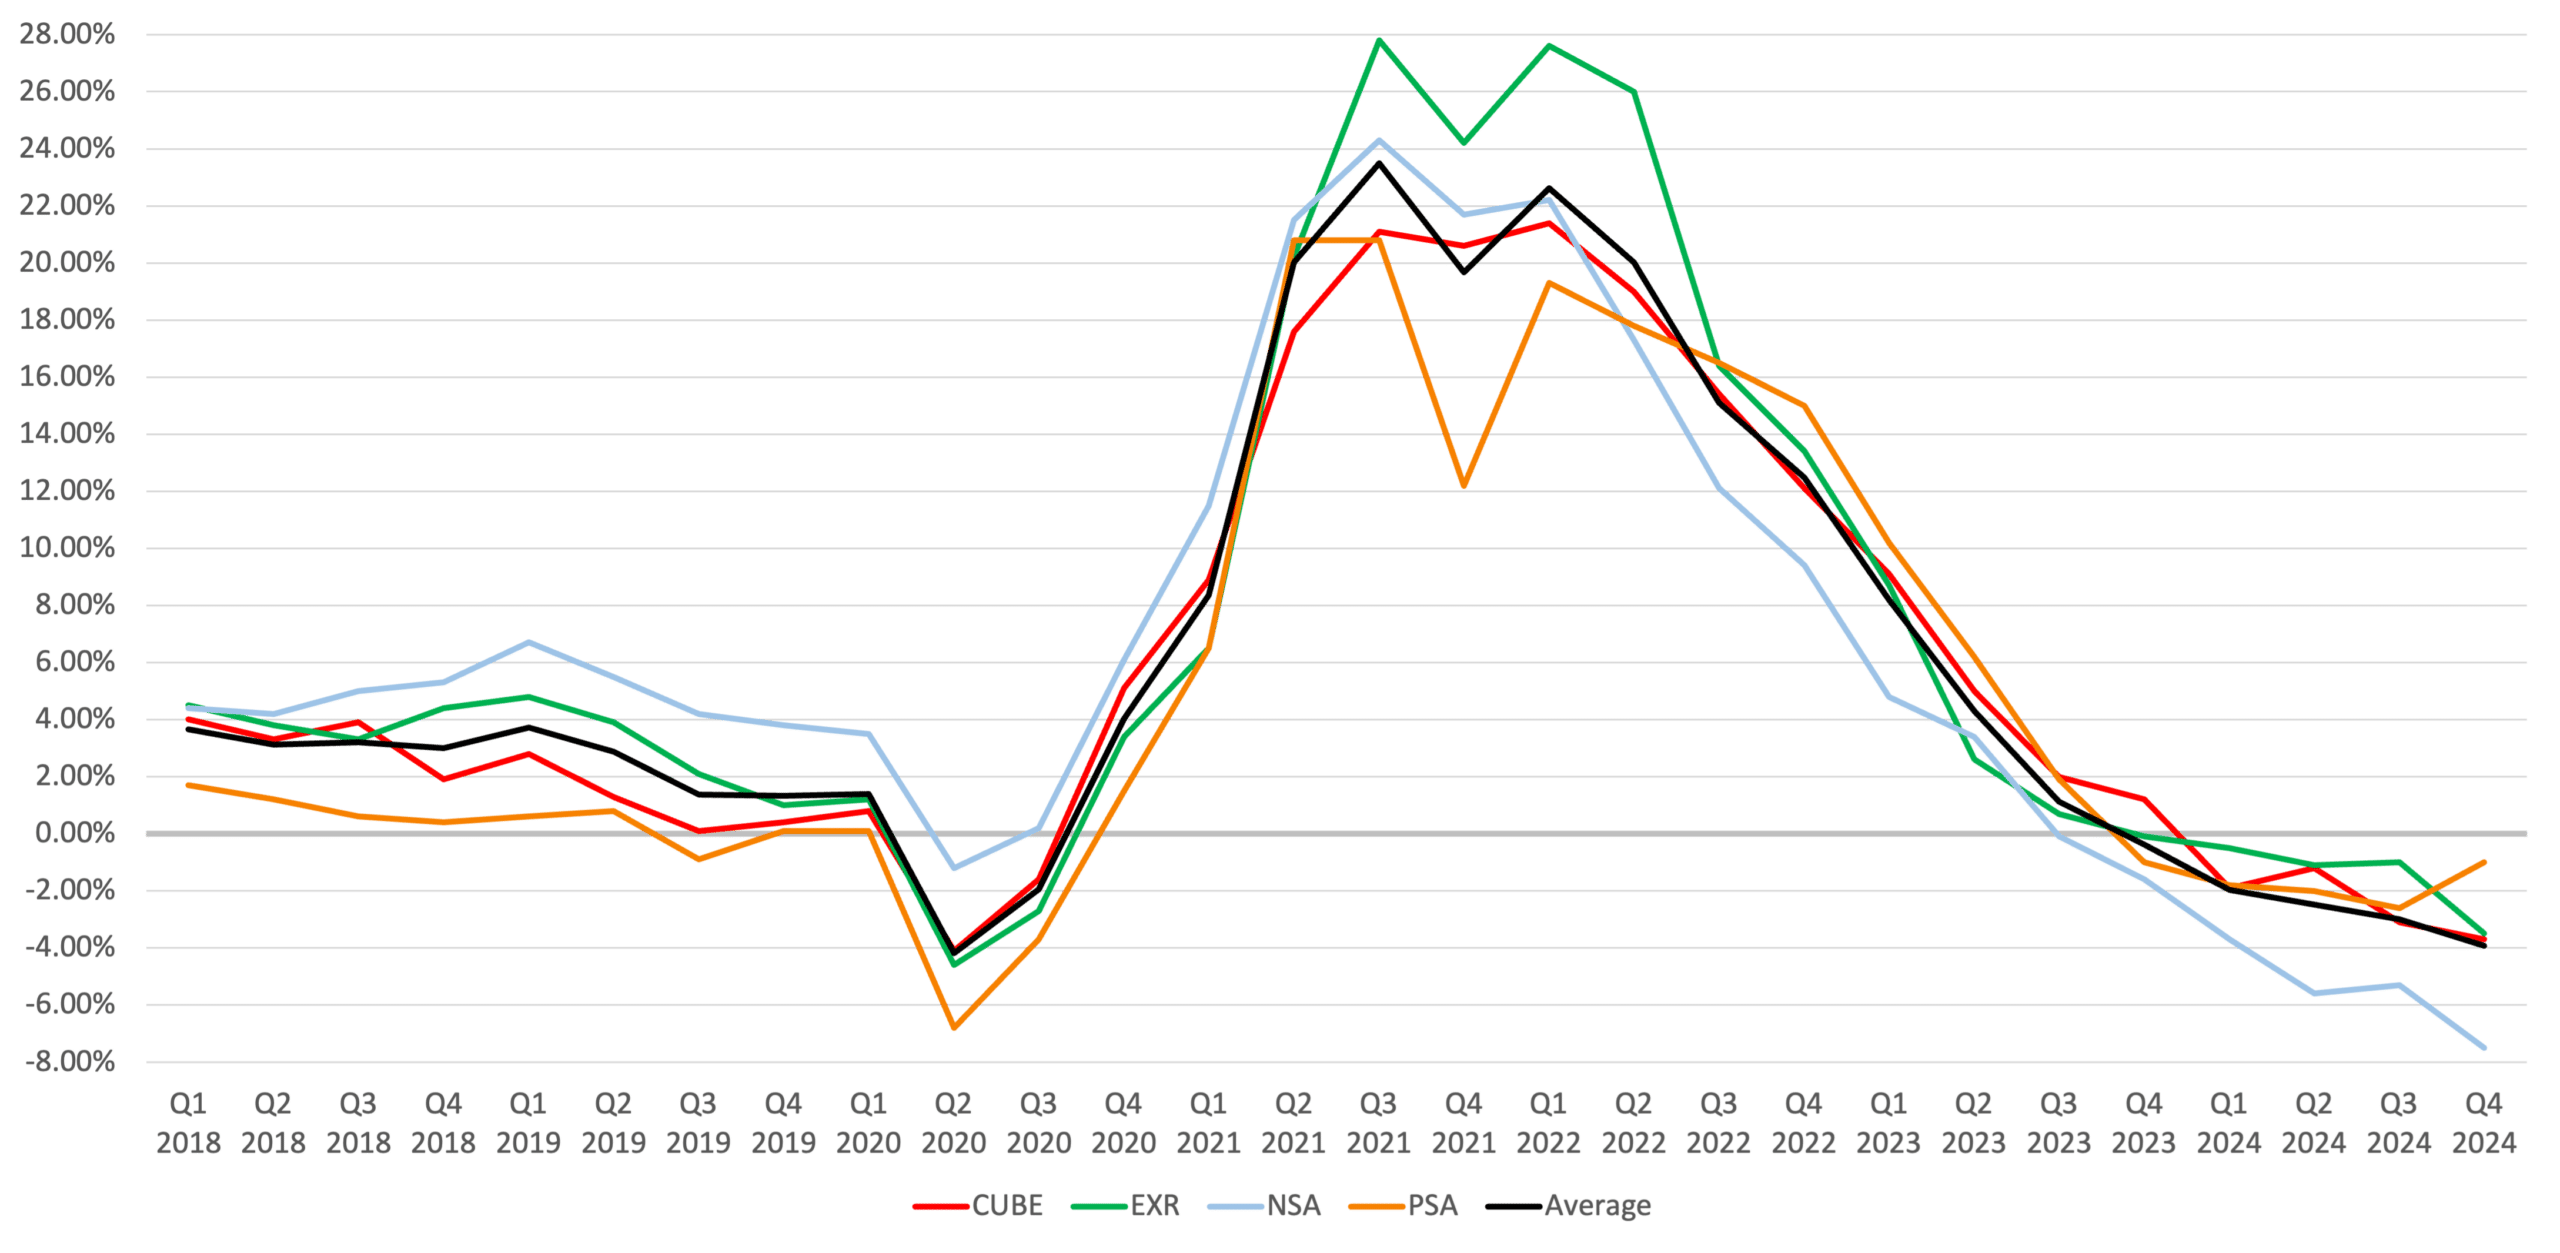
REITs prioritized occupancy retention over aggressive rate increases during 2024. Public Storage reported that occupancy was down approximately 80 basis points year-over-year at the end of 2024 and further down 40 basis points year-to-date in early 2025. Extra Space Storage emphasized maintaining near-record occupancy levels and ended the year with same-store occupancy at 93.7%. CubeSmart reported that its occupancy gap narrowed from negative 100 basis points at year-end to negative 50 basis points by the end of February 2025. National Storage Affiliates (NSA) saw its occupancy decline improve significantly, narrowing from a 270 basis-point year-over-year drop at the end of the third quarter to a 140 basis-point decline by the end of the year.
Period Ending Occupancy (Same Store)
Self-Storage Income & Expenses
Same-store revenue growth was negative across all major self-storage REITs in 2024. Public Storage’s same-store rental revenue fell by 0.6%. Extra Space Storage experienced a decline of 0.4%. CubeSmart reported a drop of 1.6%. National Storage Affiliates (NSA) saw the sharpest decline at 4.3%, due to its heavier exposure to supply-challenged secondary markets. These declines reflect the combined drag from lower move-in rates, reduced ECRI pacing, and modest occupancy softening.
Expenses grew substantially faster than revenue, leading to widespread NOI compression. CubeSmart’s property taxes surged 17.5% year-over-year in Q4, with similar tax spikes in Indiana, Georgia, and Illinois impacting Extra Space, where same-store expenses rose by 9.5%. NSA’s expenses increased by 4.7%, driven by higher marketing, utilities, and insurance premiums. Insurance costs rose 15% to 20% across all operators, with the largest increases concentrated in Florida, Texas, and California, where climate risk re-pricing drove premiums sharply higher. Public Storage held expense growth to just 1.3%, benefiting from its AI-powered staffing model, which reduced on-site labor hours by 30%, leveraging remote management capabilities in lower-touch properties.
YoY Rental Income Growth (Same Store)
YoY Expense Growth (Same Store)
YoY NOI Growth (Same Store)
Self-Storage Investment & Transaction Activity
Capital deployment in 2024 was highly selective, constrained by wide bid-ask spreads and more expensive debt financing. Total self-storage transaction volume declined approximately 25% from historical averages.
Public Storage completed $221 million in acquisitions, primarily targeting infill assets in dense urban locations. Extra Space Storage invested $950 million, including $610 million in Q4 alone, with a focus on joint ventures, bridge loans, and operational partnerships. CubeSmart acquired the remaining 80% interest in a 14-property Dallas portfolio, representing a $452.8 million investment, betting on future demand recovery in this high-growth but oversupplied metro. NSA took a pruning approach, selling $270 million in non-core assets while acquiring $39 million in properties and deploying $150 million into joint ventures, targeting markets where development pipelines are tapering off.
Acquisition Dollar Amount History
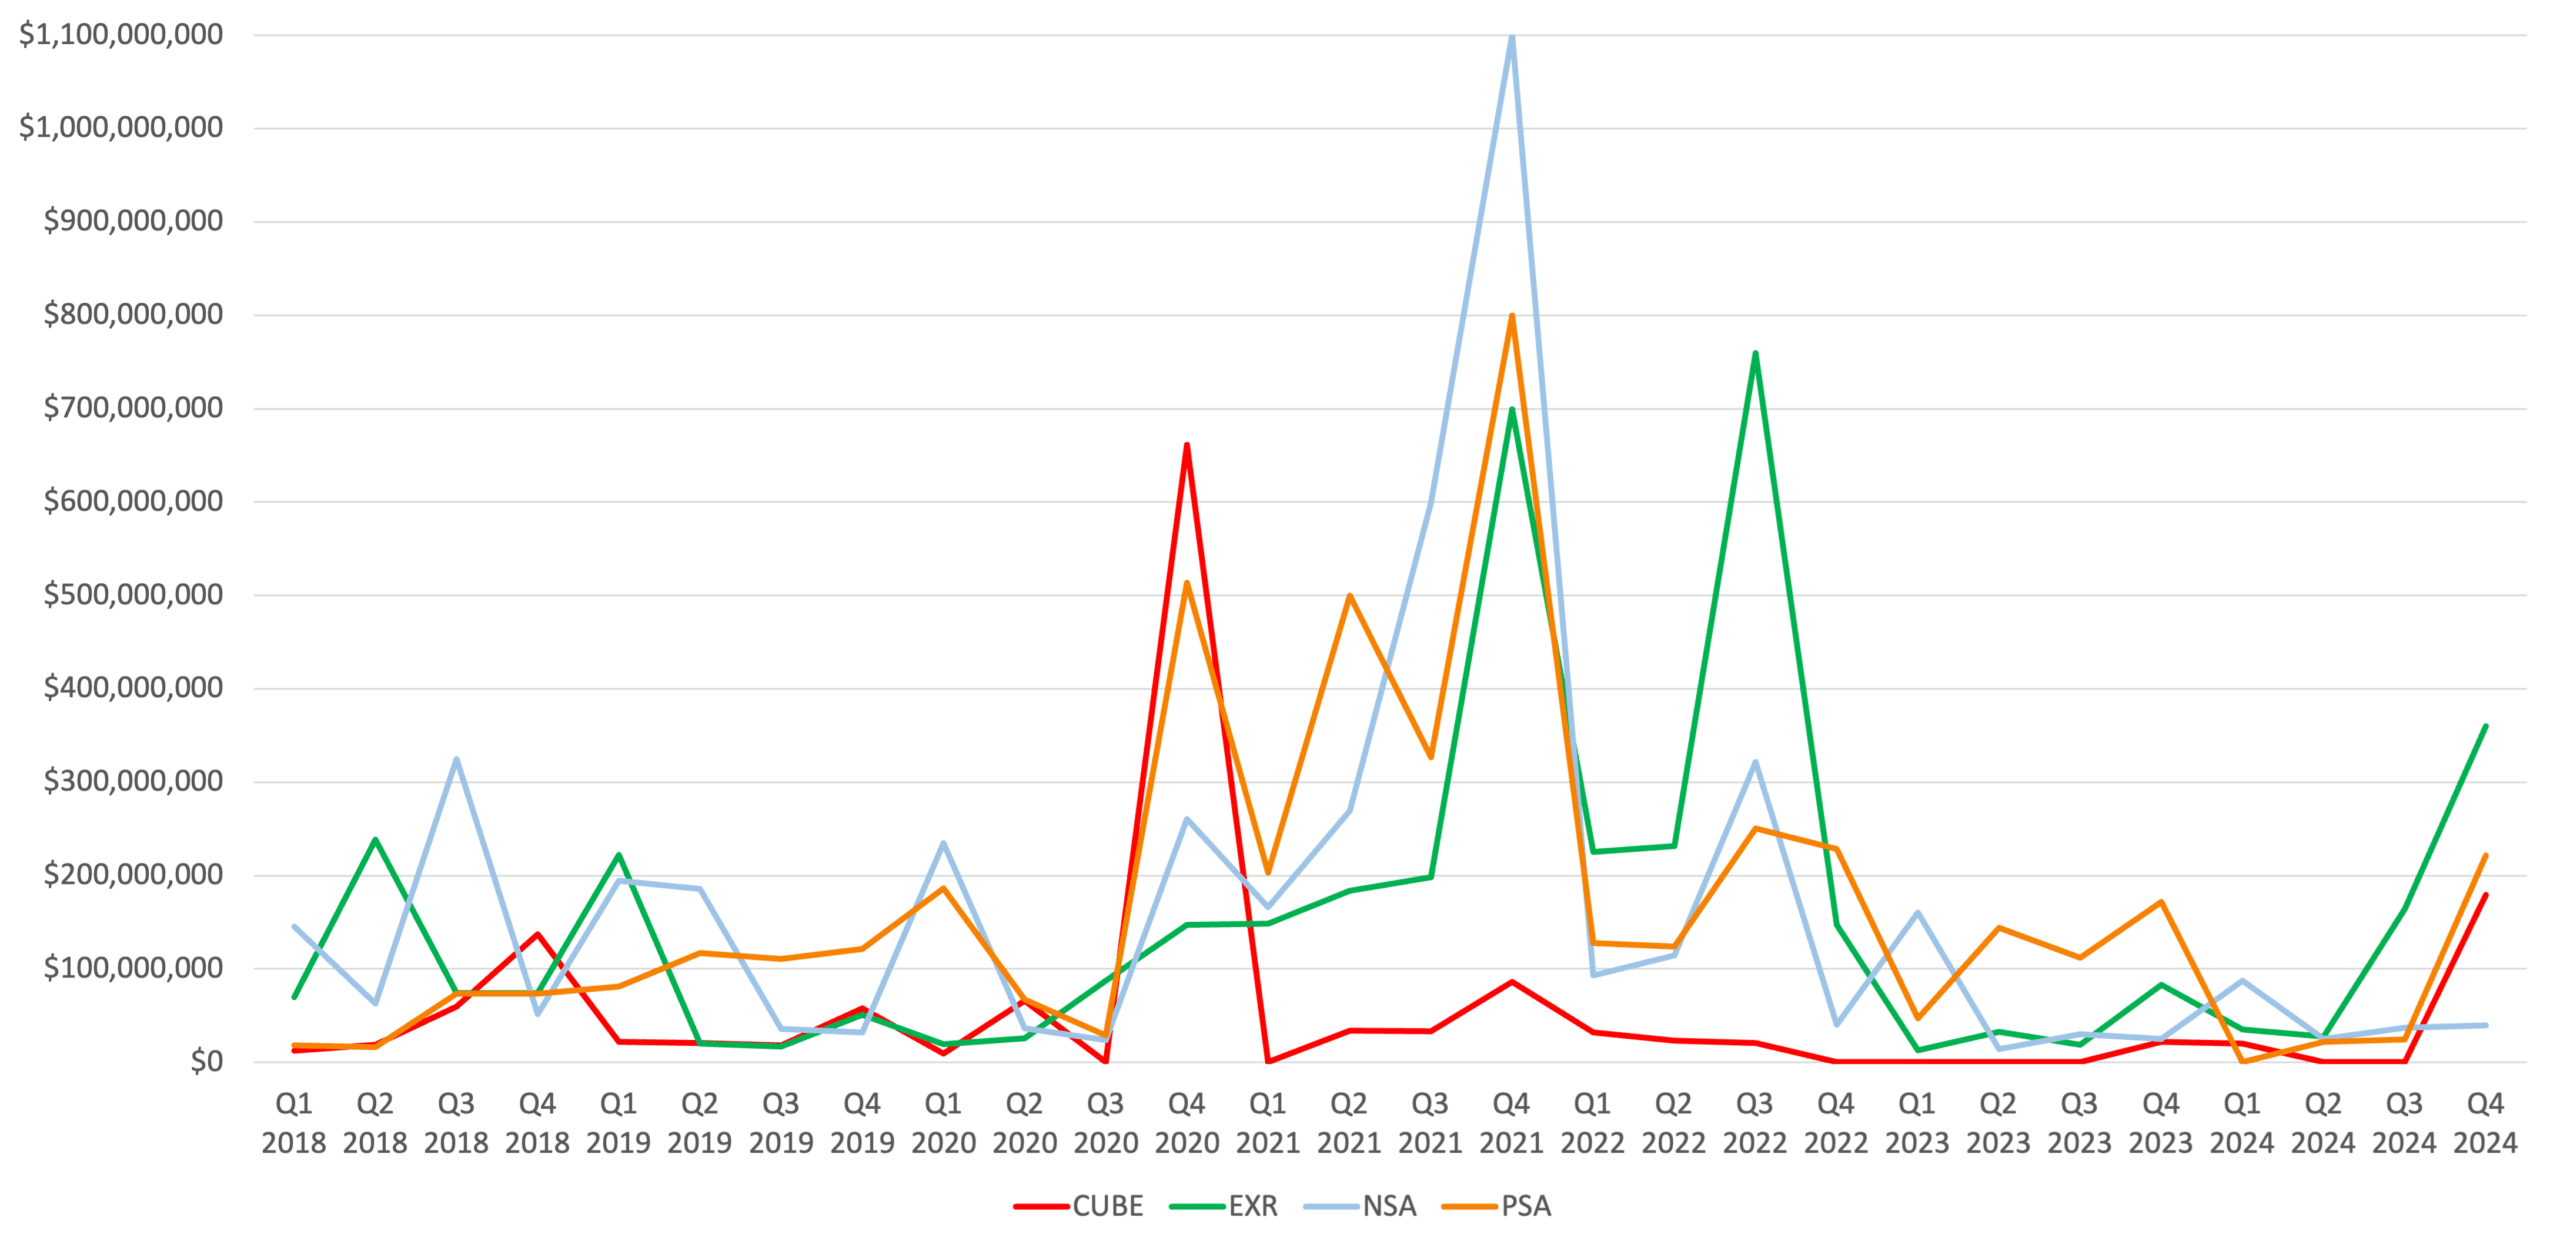
*Excludes PSA Acquisition of ezStorage in Q2 2021 for $1.8 Billion
*Excludes PSA Acquisition of All Storage in Q4 2021 for $1.5 Billion
*Excludes PSA Acquisition of Simply Storage in Q3 2023 for $2.2 Billion
*Excludes EXR Acquisition of Life Storage in Q3 2023 for $11.6 Billion
Self-Storage Monthly Transactions 2018-2024
* Source: CoStar
Under Construction NRSF as a % of Existing Inventory
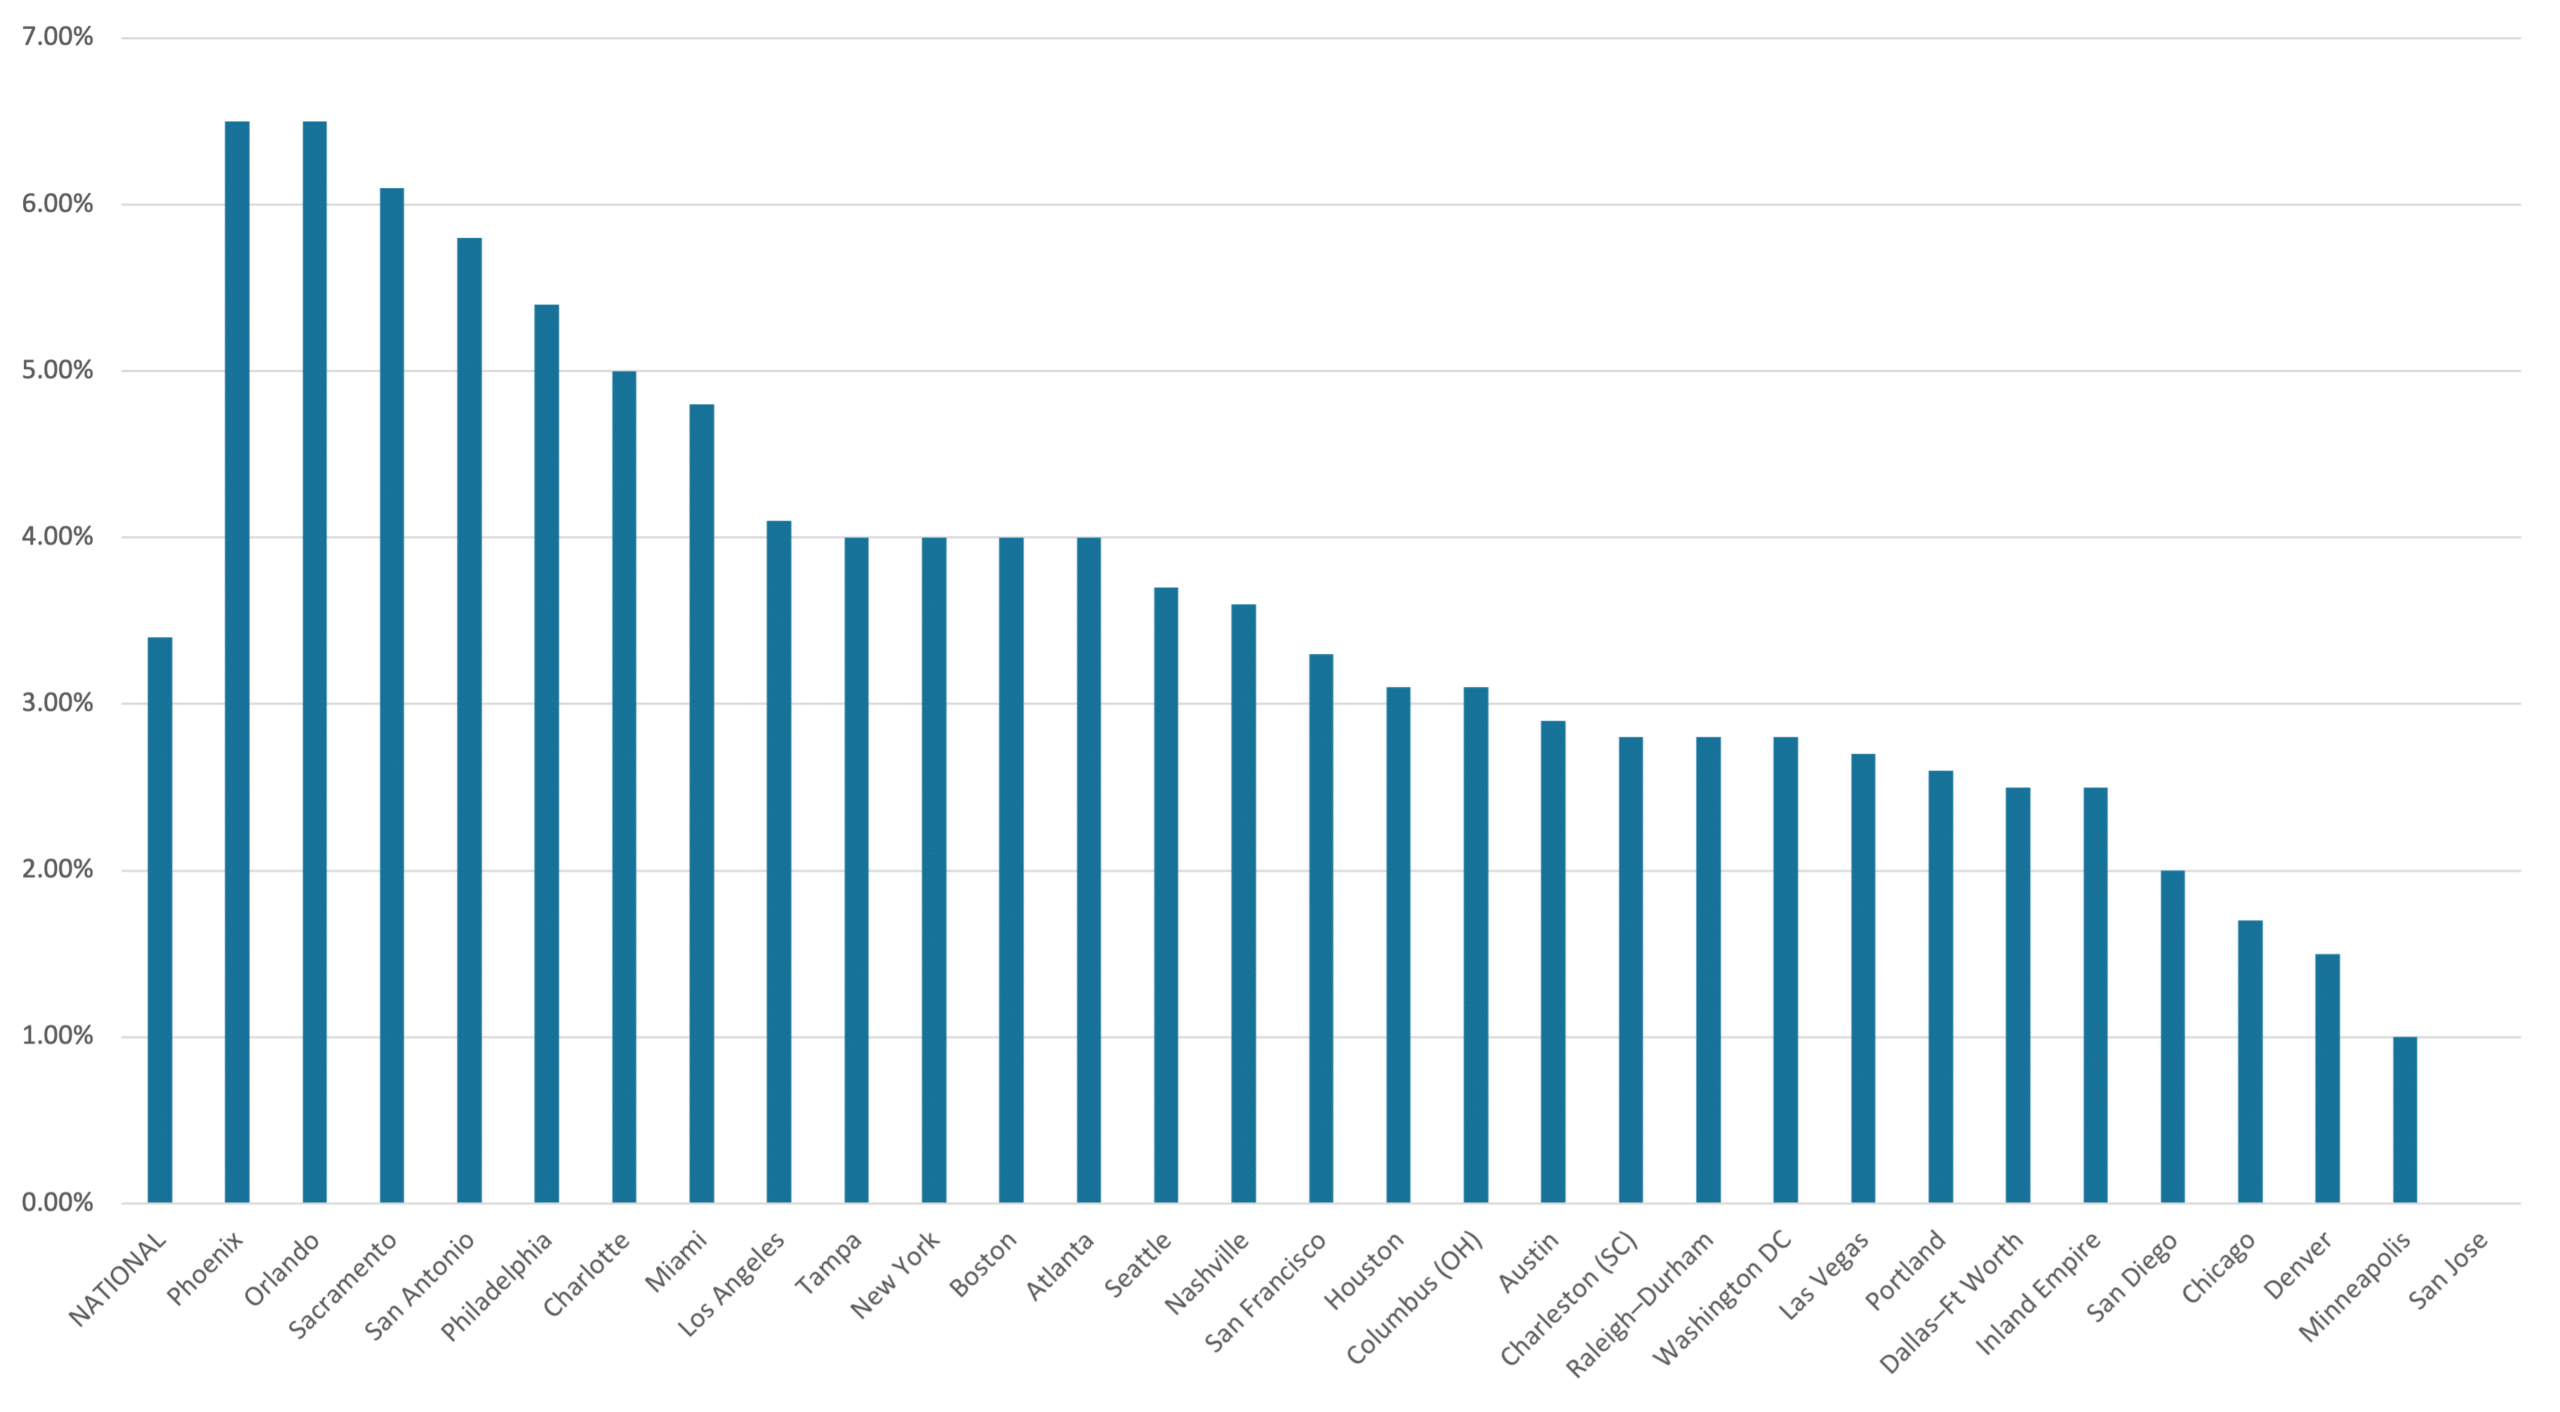
* Source: Yardi Matrix
NRSF Delivered as a % of Starting Inventory
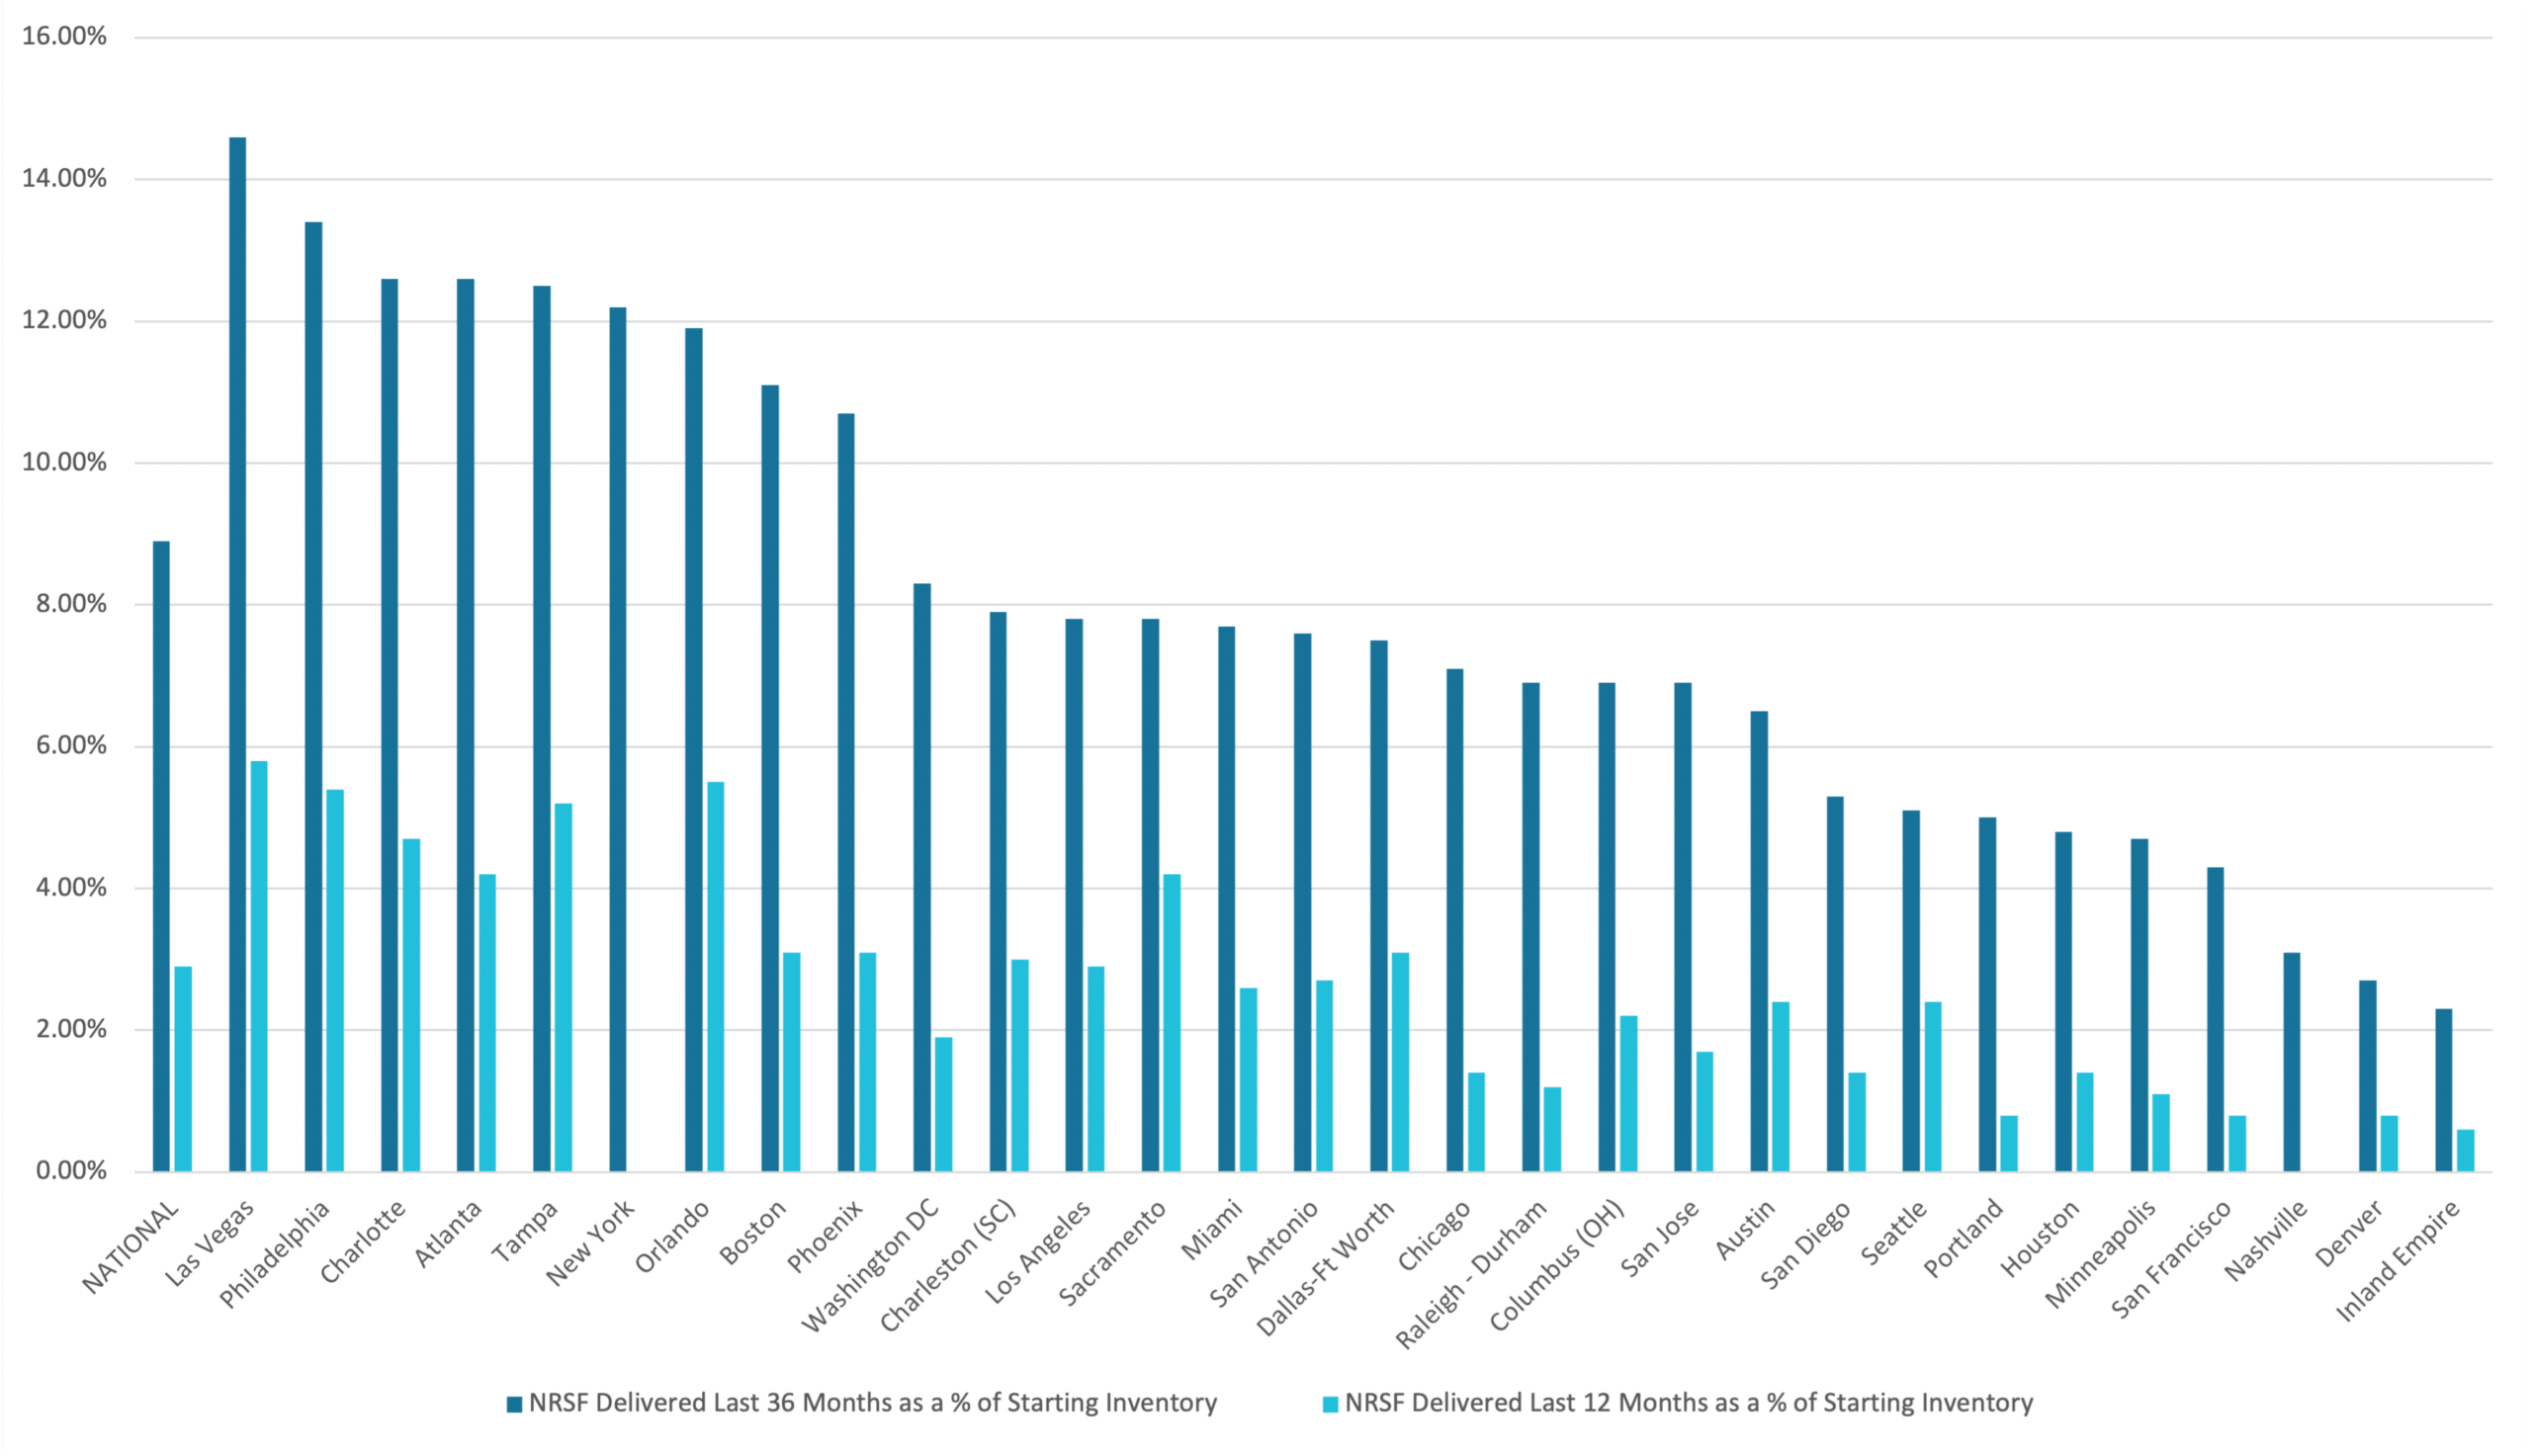
* Source: Yardi Matrix
Self-Storage Cap Rates & Bid-Ask Spread
The transaction environment remained highly selective in 2024, driven by persistent pricing gaps between buyers and sellers amid ongoing interest rate volatility. Most deal activity was concentrated in smaller, single-asset, and off-market transactions, as few large portfolio transactions materialized. Public Storage noted total industry-wide transaction volume was approximately $4 billion for the year, marking a multi-year low. Cap rates for stabilized properties generally ranged from mid-5% to low-6%.
Extra Space Storage highlighted that nearly all of its $950 million investment activity in 2024, with over $610 million occurring in the fourth quarter, was sourced off-market through existing relationships. Similarly, National Storage Affiliates saw stable deal flow primarily in smaller transactions, closing around $40 million in Q4 2024, and indicated continued market discipline as cap rates and asset prices showed little movement. Institutional investors remained cautious overall due to ongoing valuation uncertainties and the persistent pricing gap between buyers and sellers, limiting larger portfolio trades and focusing activity primarily on single-asset and relationship-driven opportunities.
Implied Cap Rate History
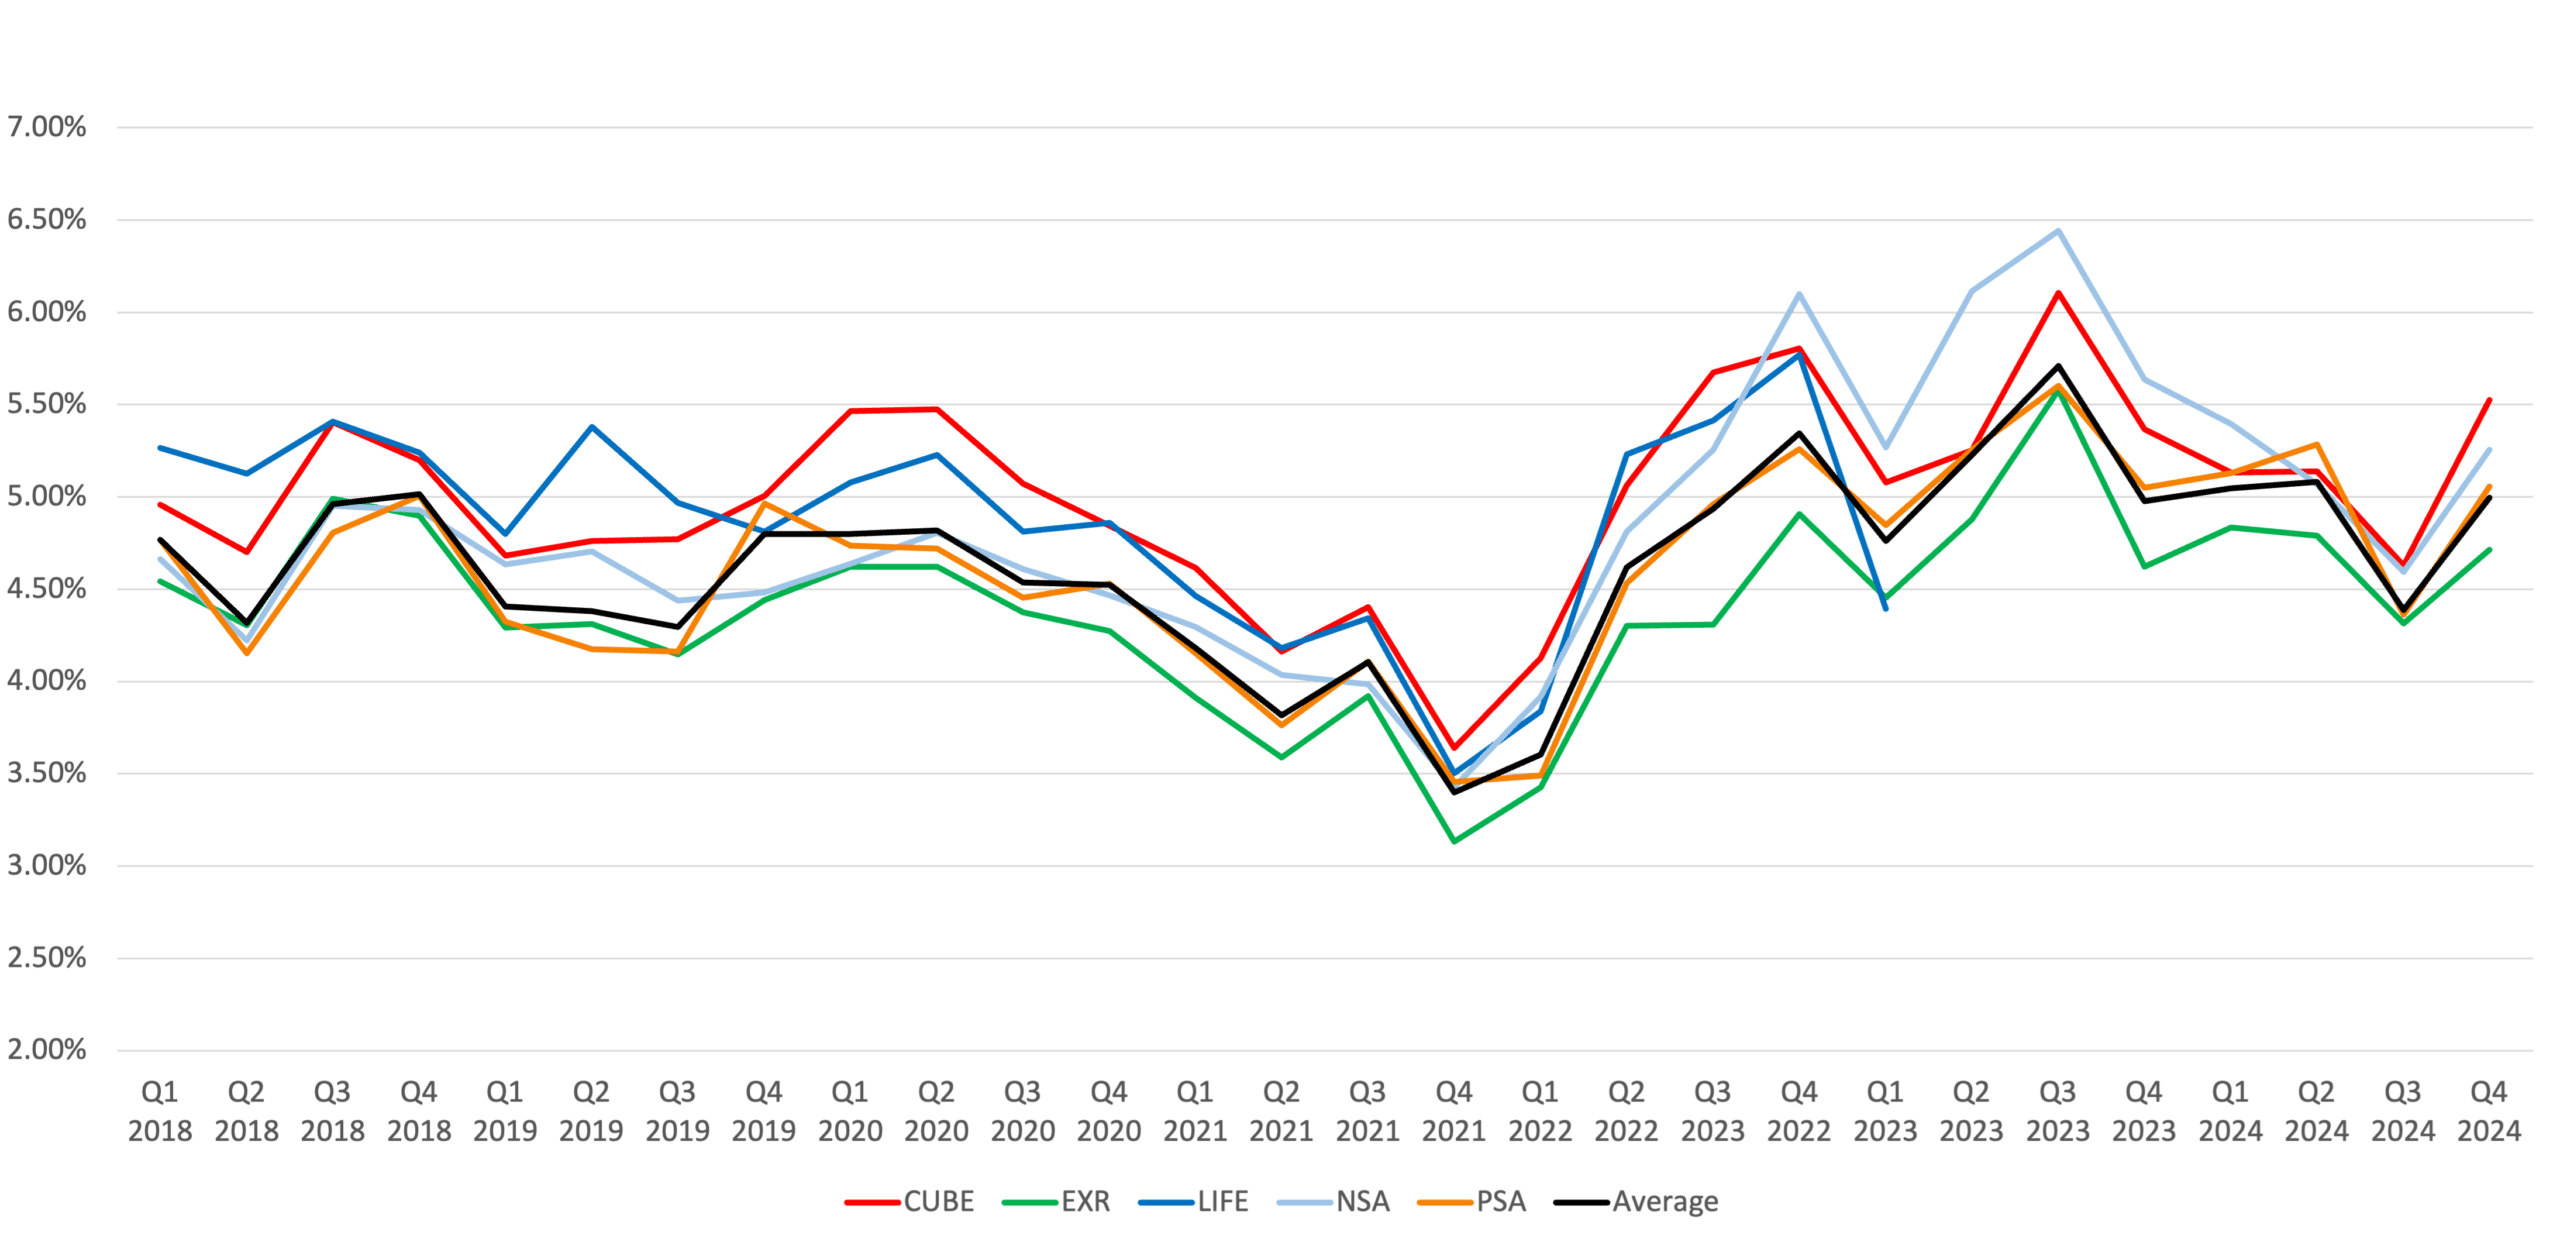
*The implied cap rate data indicates the market value of each REIT.
The implied capitalization rate is a culmination of the company value and total debt of each company divided by its NOI.
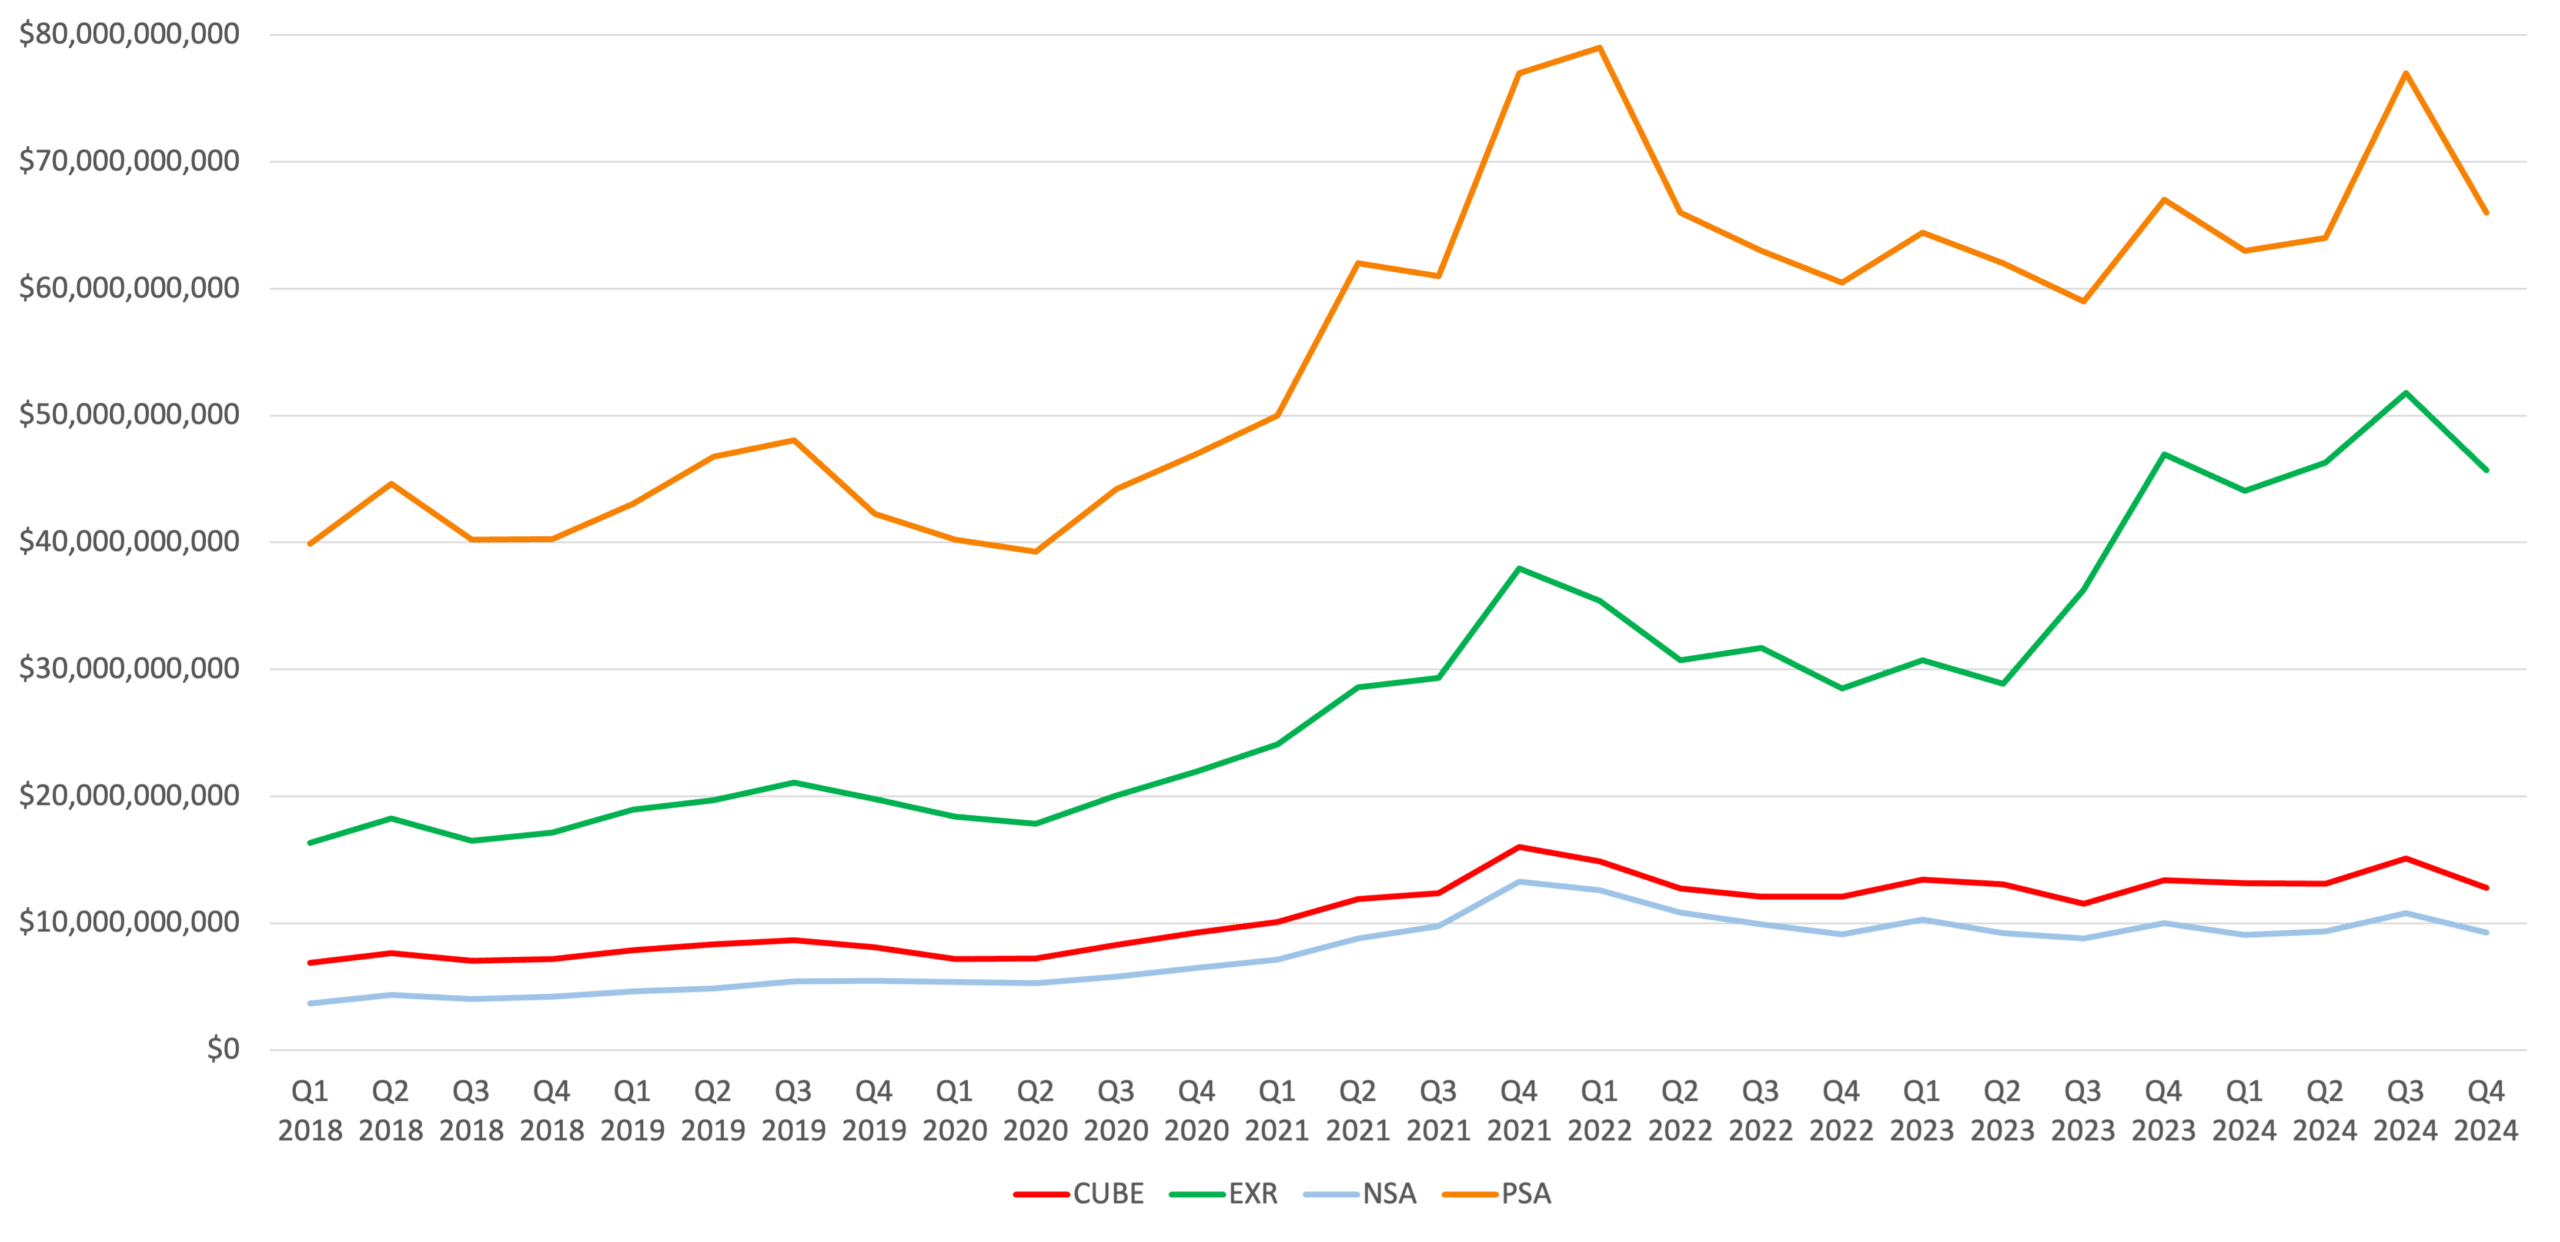
Enterprise Value History
Headwinds in the Self-Storage Market
The weak housing market remains the primary near-term headwind for the self-storage sector, with home sales hovering near multi-decade lows. National Storage Affiliates (NSA) specifically noted that U.S. housing turnover has fallen below Great Financial Crisis (GFC) levels, currently near its lowest point in the past 40 years. CubeSmart reinforced this, citing core inflation pressures that continue to weigh on consumer demand, leaving occupancy levels approximately 50 basis points lower year-over-year as of February 2025, despite modest recent improvements. Extra Space Storage further illustrated pricing impacts by noting that new customer rates were down 9% in Q3 2024, improved slightly to down 6% by year-end, and were approximately flat year-over-year by early 2025. Public Storage reported that although move-in volumes were up 5% year-over-year in early 2025, move-in rates remained down roughly 8%, indicating sustained pressure on rental pricing power as a result of limited housing-driven mobility. Collectively, these metrics illustrate a stabilized yet persistently challenging environment, highlighting the critical dependency of self-storage operators on improvements in housing market conditions for a meaningful recovery.
Tailwinds in the Self-Storage Market
Despite near-term challenges, the longer-term outlook for self-storage remains favorable. National Storage Affiliates (NSA) expects new supply pressures to decline meaningfully, with new deliveries in its markets projected to decrease from 3.5% of existing stock in 2024 to approximately 2% by 2027, reflecting easing supply headwinds over time. Public Storage similarly pointed to a multi-year reduction in competitive new supply, driven by difficult entitlement processes, prolonged timing, and increased construction costs, all of which have discouraged new development activity. Additionally, operators emphasized strategic initiatives, including significant investments in digital platforms, centralized operating systems, AI-driven staffing efficiencies, and technology enhancements aimed at improving rental conversions and customer retention. These ongoing operational improvements, coupled with favorable demographic-driven demand—such as millennial household formation and broader demographic mobility—continue to support the sector’s long-term fundamentals.
Q4 2024 Self-Storage REIT Data by MSA
| Average Occupancy Same Store | Achieved Rate Same Store | |||||||||||
| CUBE | EXR | NSA | PSA | Average | CUBE | EXR | NSA | PSA | Average | |||
| Atlanta, GA | 88.20% | 93.80% | 81.60% | 88.40% | 88.00% | Atlanta, GA | $16.38 | $17.35 | $13.20 | $16.75 | $15.92 | |
| Austin, TX | 85.30% | 93.70% | 83.50% | - | 87.50% | Austin, TX | $18.61 | $17.87 | $17.08 | - | $17.85 | |
| Baltimore, MD | 90.90% | - | - | 91.60% | 91.25% | Baltimore, MD | $22.87 | - | - | $23.36 | $23.12 | |
| Boston, MA | 86.60% | 94.40% | - | - | 90.50% | Boston, MA | $26.92 | $28.38 | - | - | $27.65 | |
| Bridgeport, CT | 88.40% | - | - | - | 88.40% | Bridgeport, CT | $29.45 | - | - | - | $29.45 | |
| Brownsville, TX | - | - | 88.50% | - | 88.50% | Brownsville, TX | - | - | $12.93 | - | $12.93 | |
| Charleston, SC | 85.60% | 94.60% | - | - | 90.10% | Charleston, SC | $16.41 | $18.20 | - | - | $17.31 | |
| Charlotte, NC | 89.20% | - | - | 90.50% | 89.85% | Charlotte, NC | $18.57 | - | - | $15.91 | $17.24 | |
| Chicago, IL | 92.00% | 94.10% | - | 92.40% | 92.83% | Chicago, IL | $19.54 | $20.48 | - | $20.64 | $20.22 | |
| Cincinnati, OH | - | 95.00% | - | - | 95.00% | Cincinnati, OH | - | $13.41 | - | - | $13.41 | |
| Cleveland, OH | 88.30% | - | - | - | 88.30% | Cleveland, OH | $16.89 | - | - | - | $16.89 | |
| Colorado Springs, CO | - | - | 83.40% | - | 83.40% | Colorado Springs, CO | - | - | $13.74 | - | $13.74 | |
| Columbus, OH | 87.40% | 90.70% | - | - | 89.05% | Columbus, OH | $14.13 | $12.46 | - | - | $13.30 | |
| Dallas, TX | 89.00% | 94.00% | 80.70% | 87.80% | 87.88% | Dallas, TX | $18.61 | $18.09 | $14.36 | $18.22 | $17.32 | |
| DC | 89.90% | 94.60% | - | 92.00% | 92.17% | DC | $27.16 | $24.47 | - | $27.27 | $26.30 | |
| Denver, CO | 89.60% | 93.10% | - | - | 91.35% | Denver, CO | $18.93 | $19.05 | - | - | $18.99 | |
| Ft Myers, FL | 89.30% | - | - | - | 89.30% | Ft Myers, FL | $19.95 | - | - | - | $19.95 | |
| Hawaii, HI | - | 91.60% | - | - | 91.60% | Hawaii, HI | - | $46.18 | - | - | $46.18 | |
| Hartford, CT | 89.50% | - | - | - | 89.50% | Hartford, CT | $17.53 | - | - | - | $17.53 | |
| Houston, TX | 91.30% | 94.50% | 87.30% | 91.30% | 91.10% | Houston, TX | $17.83 | $17.36 | $13.16 | $17.16 | $16.38 | |
| Indianapolis. IN | - | 90.00% | - | - | 90.00% | Indianapolis. IN | - | $11.97 | - | - | $11.97 | |
| Jacksonville, FL | 90.20% | - | - | - | 90.20% | Jacksonville, FL | $20.87 | - | - | - | $20.87 | |
| Las Vegas, NV | 90.40% | 92.40% | 86.50% | - | 89.77% | Las Vegas, NV | $19.02 | $17.38 | $14.21 | - | $16.87 | |
| Los Angeles, CA | 90.70% | 94.50% | 86.20% | 94.10% | 91.38% | Los Angeles, CA | $28.43 | $30.08 | $24.48 | $36.23 | $29.81 | |
| Louisville, KY | - | 90.70% | - | - | 90.70% | Louisville, KY | - | $11.64 | - | - | $11.64 | |
| Memphis, TN | - | 92.70% | - | - | 92.70% | Memphis, TN | - | $11.74 | - | - | $11.74 | |
| McAllen, TX | - | - | 89.10% | - | 89.10% | McAllen, TX | - | - | $13.24 | - | $13.24 | |
| Miami, FL | 92.00% | 94.30% | - | 92.60% | 92.97% | Miami, FL | $25.48 | $27.64 | - | $29.95 | $27.69 | |
| Nashville, TN | 88.00% | - | - | - | 88.00% | Nashville, TN | $16.75 | - | - | - | $16.75 | |
| New Orleans, LA | - | - | 79.40% | - | 79.40% | New Orleans, LA | - | - | $15.18 | - | $15.18 | |
| New York | 90.40% | 94.70% | - | 93.00% | 92.70% | New York | $37.46 | $29.60 | - | $32.48 | $33.18 | |
| Norfolk, VA | - | 94.20% | - | - | 94.20% | Norfolk, VA | - | $18.13 | - | - | $18.13 | |
| OKC, OK | - | - | 84.40% | - | 84.40% | OKC, OK | - | - | $11.12 | - | $11.12 | |
| Orlando, FL | 91.90% | 93.60% | - | 91.30% | 92.27% | Orlando, FL | $16.87 | $17.28 | - | $18.78 | $17.64 | |
| Philadelphia, PA | 89.70% | 93.70% | - | 92.60% | 92.00% | Philadelphia, PA | $21.20 | $20.16 | - | $20.65 | $20.67 | |
| Phoenix, AZ | 89.20% | 93.80% | 82.60% | - | 88.53% | Phoenix, AZ | $17.17 | $17.29 | $15.57 | - | $16.68 | |
| Portland. OR | - | 95.90% | 88.40% | - | 92.15% | Portland. OR | - | $19.81 | $18.81 | - | $19.31 | |
| Providence, RI | 90.20% | - | - | - | 90.20% | Providence, RI | $19.73 | - | - | - | $19.73 | |
| Richmond, VA | - | 95.60% | - | - | 95.60% | Richmond, VA | - | $18.39 | - | - | $18.39 | |
| Riverside, CA | 86.90% | - | 86.90% | - | 86.90% | Riverside, CA | $19.76 | - | $15.90 | - | $17.83 | |
| Sacramento, CA | 88.60% | 95.10% | - | - | 91.85% | Sacramento, CA | $17.87 | $20.54 | - | - | $19.21 | |
| San Antonio, TX | 88.60% | - | 82.90% | - | 85.75% | San Antonio, TX | $16.67 | - | $15.22 | - | $15.95 | |
| San Diego, CA | 89.00% | - | - | - | 89.00% | San Diego, CA | $27.08 | - | - | - | $27.08 | |
| San Fransisco, CA | - | 95.00% | - | 93.30% | 94.15% | San Fransisco, CA | - | $35.35 | - | $33.12 | $34.24 | |
| Sarasota, FL | - | - | 89.50% | - | 89.50% | Sarasota, FL | - | - | $19.56 | - | $19.56 | |
| Seattle, WA | - | - | - | 92.00% | 92.00% | Seattle, WA | - | - | - | $25.96 | $25.96 | |
| Tampa, FL | 93.60% | 96.30% | - | - | 94.95% | Tampa, FL | $20.92 | $19.75 | - | - | $20.34 | |
| Toucson, AZ | 83.90% | - | - | - | 83.90% | Toucson, AZ | $17.08 | - | - | - | $17.08 | |
| Tulsa, OK | - | - | 84.90% | - | 84.90% | Tulsa, OK | - | - | $11.01 | - | $11.01 | |
| West Palm Beach, FL | - | - | - | 91.60% | 91.60% | West Palm Beach, FL | - | - | - | $26.09 | $26.09 | |
| Wichita, KS | - | - | 85.80% | - | 85.80% | Wichita, KS | - | - | $13.10 | - | $13.10 | |
| Other | 89.10% | 94.50% | 84.70% | 91.80% | 90.03% | Other | $19.02 | $17.65 | $15.17 | $18.40 | $17.56 | |
| Total | 89.60% | 94.10% | 85.20% | 91.80% | 90.18% | Total | $22.89 | $21.63 | $15.56 | $22.66 | $20.69 | |
Contributors
Steven Paul
Senior Financial Analyst
Aaron Sanchez
Managing Director
Scott Schoettlin
Managing Director