Key Takeaways
- Rental rates across the sector showed variability, with some companies experiencing growth and others facing declines. Extra Space Storage implemented measures leading to an 8% sequential increase in move-in rates, while CubeSmart noted an 11% decline in new customer rental rates in April but saw a gradual recovery. Public Storage demonstrated resilience with notable month-over-month revenue growth in key markets, and NSA experienced a 14% year-over-year decrease in move-in rates but saw positive trends in net move-in activity.
- Occupancy rates varied, with some REITs seeing improvements and others facing challenges. Extra Space Storage and Life Storage showcased robust occupancy rates of 93.2% and 92%, respectively. CubeSmart had a slight decline to 90.4%, but stabilization was evident by April’s end. Public Storage managed to narrow occupancy declines through positive net move-in volumes, while NSA saw a significant year-over-year decline but experienced seasonal upticks.
- Investment and transaction activities were notable across the sector. Extra Space Storage secured $164 million in new bridge loans and expanded its portfolio with 97 third-party managed stores. CubeSmart acquired a two-store portfolio for $20.2 million. Public Storage projected $450 million in development deliveries and aimed for $500 million in acquisitions later in the year. NSA completed over $200 million in common share buybacks and maintained a cautious approach to acquisitions.
Contributors
Steven Paul
Senior Financial Analyst
Scott Schoettlin
Managing Director
Q1 2024 Self-Storage REIT Data Overview
| Same Store Ending Occupancy | Same Store YoY Revenue Increase | Same Store YoY Expense Increase | Same Store YoY NOI Increase | Same Store Achieved Rate | Q1 Acquisitions | ||||||||
| 2024 | 2023 | 2024 | 2023 | 2024 | 2023 | 2024 | 2023 | 2024 | 2023 | % Change | 2024 | 2023 | |
| EXR | 93.20% | 92.70% | 1.00% | 7.40% | 5.50% | 3.50% | -0.50% | 8.70% | $21.62 | $21.66 | -0.2% | 6 | 1 |
| CUBE | 90.40% | 91.70% | 0.00% | 6.90% | 5.00% | 1.00% | -1.90% | 9.10% | $23.60 | $23.17 | 1.9% | 2 | 0 |
| PSA | 91.90% | 92.50% | 0.10% | 9.80% | 4.80% | 5.60% | -1.50% | 11.20% | $22.59 | $22.66 | -0.3% | 0 | 5 |
| NSA | 85.90% | 89.40% | -1.50% | 5.70% | 4.50% | 8.30% | -3.70% | 4.80% | $15.80 | $15.43 | 2.4% | 0 | 16 |
Q1 Self-Storage REIT Highlights
- Achieved an 8% sequential increase in average move-in rates from January’s seasonal low and a 1% uplift in same-store revenue performance.
- Reached a robust 93.2% occupancy, showcasing impressive sequential improvements and market resilience.
- Managed a 5.5% year-over-year increase in same-store expenses, aligning with projections, while demonstrating resilience in financial management.
- Experienced typical seasonal fluctuations with rates rebounding by the end of March, despite an 11% decline in new customer rental rates in April compared to the previous year.
- Stabilized occupancy at 90.8% by April’s end, with a slight decline in average occupancy to 90.4% for its same-store portfolio.
- Encountered a 5% surge in operating expenses despite stagnant same-store revenues, mitigated by a 15% reduction in advertising costs due to more efficient marketing approaches.
- Demonstrated resilience by successfully increasing move-in rates, particularly in pivotal markets such as Washington, D.C., Baltimore, and Seattle, driving substantial month-over-month revenue growth.
- Projected $450 million in development deliveries and aimed for $500 million in acquisitions during the latter half of the year, reflecting confidence in future transactions despite subdued volumes.
- Experienced modest revenue growth from rent escalations within the same store portfolio, countered by a noticeable rise in operating expenses due to increased property taxes and marketing expenditures.
- Witnessed a seasonal uptick in occupancy to 86% by April’s end, supported by positive net rentals despite a 14% year-over-year decrease in move-in rates due to aggressive pricing strategies.
- Saw a significant 350 basis point year-over-year decline in same-store occupancies, ending the quarter at 85.9%, partially offset by seasonal upticks.
- Experienced a 1.5% decline in revenue growth on a same-store basis, offset by a 2.4% growth in rent revenue per square foot, with operating expenses surging by 4.5%.
Q1 2024 Self-Storage Operating Fundamentals
Self-Storage Rental Rates
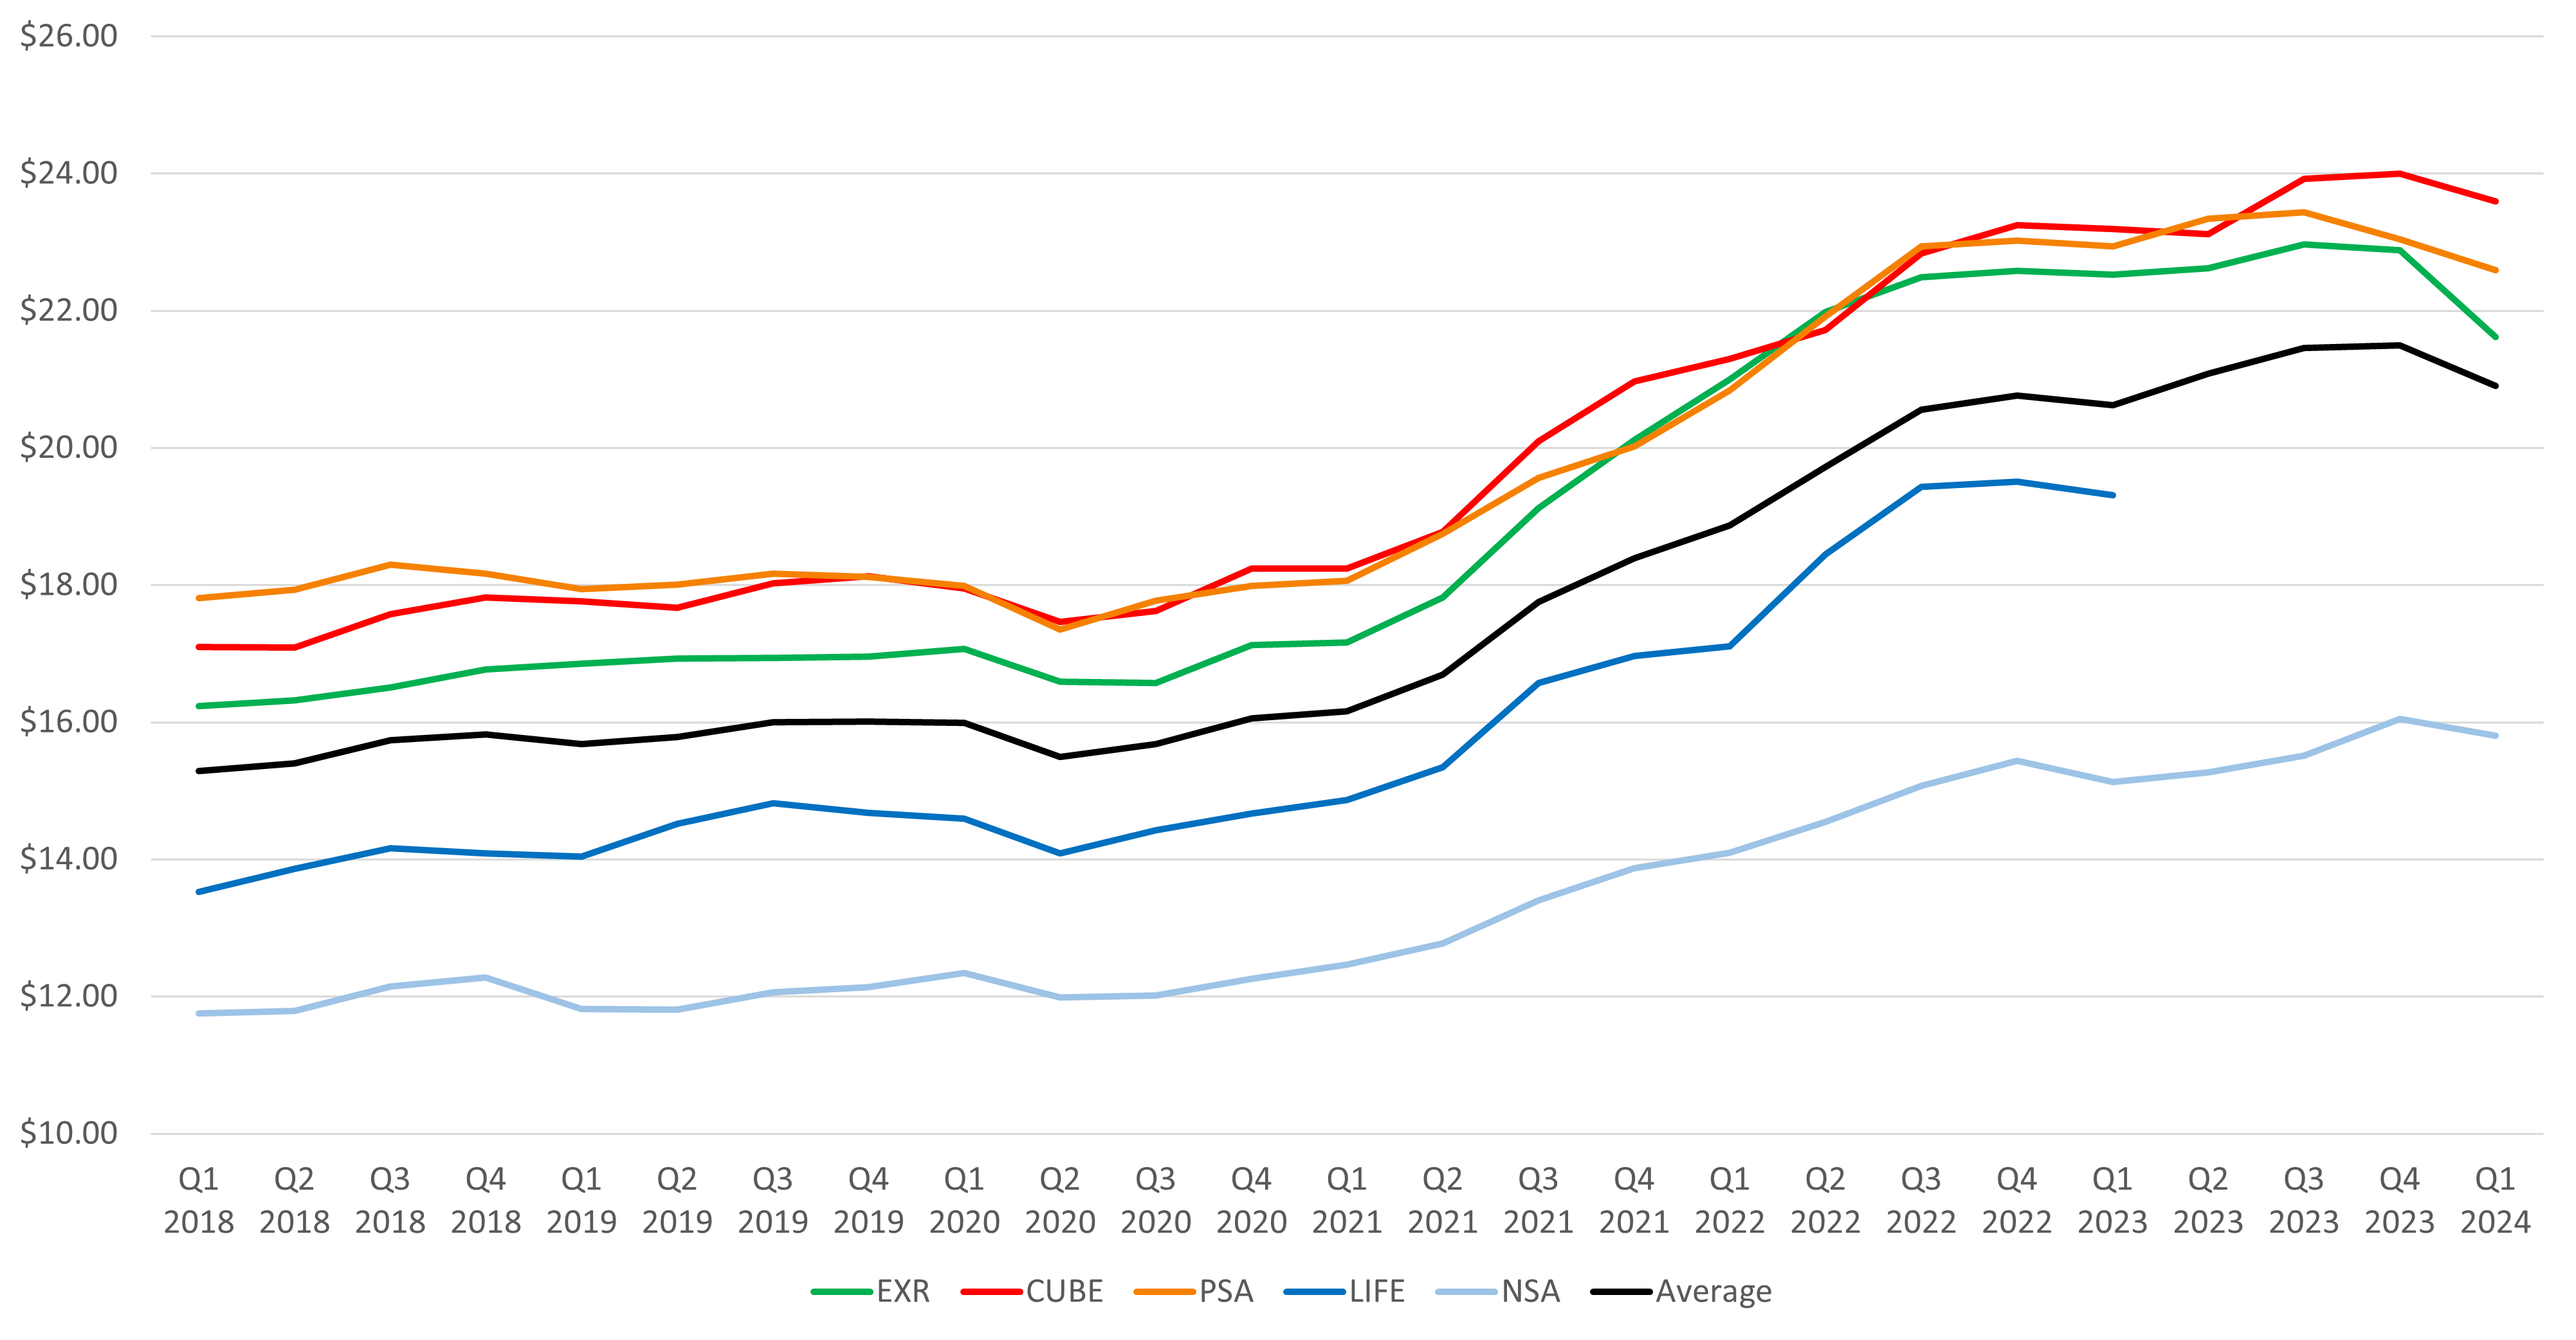
During the first quarter of 2024, the self-storage REIT sector saw nuanced shifts in rental rates across various companies. Extra Space Storage implemented strategic measures to bolster both occupancy and average move-in rates, leading to a notable 8% sequential increase from January’s seasonal low and a commendable 1% uplift in same-store revenue performance. CubeSmart experienced typical seasonal fluctuations, with rates bottoming out in mid-February before gradually rebounding by the end of March. Despite a significant 11% decline in new customer rental rates in April compared to the previous year, CubeSmart noted a gradual improvement from preceding quarters, attributing this to ongoing market recovery and regional disparities in performance. Public Storage demonstrated resilience by successfully augmenting move-in rates, particularly in pivotal markets like Washington, D.C., Baltimore, and Seattle, which fueled substantial month-over-month revenue growth. Additionally, momentum continued to build in other markets such as San Francisco, New York, Chicago, Philadelphia, Detroit, and Minneapolis. Meanwhile, National Storage Affiliates Trust witnessed a seasonal uptick in occupancy, reaching 86% by April’s end, supported by three months of positive net rentals. However, aggressive pricing strategies led to a notable 14% year-over-year decrease in move-in rates, tempered by positive trends in net move-in activity for April. It’s worth noting that slight decreases in street rate and move-in rate compared to the previous quarter indicate the significant influence of market dynamics and historical trends on current rental rates within the self-storage industry.
Self-Storage REITs - Achieved Rates (Same Store)
Self-Storage Occupancy
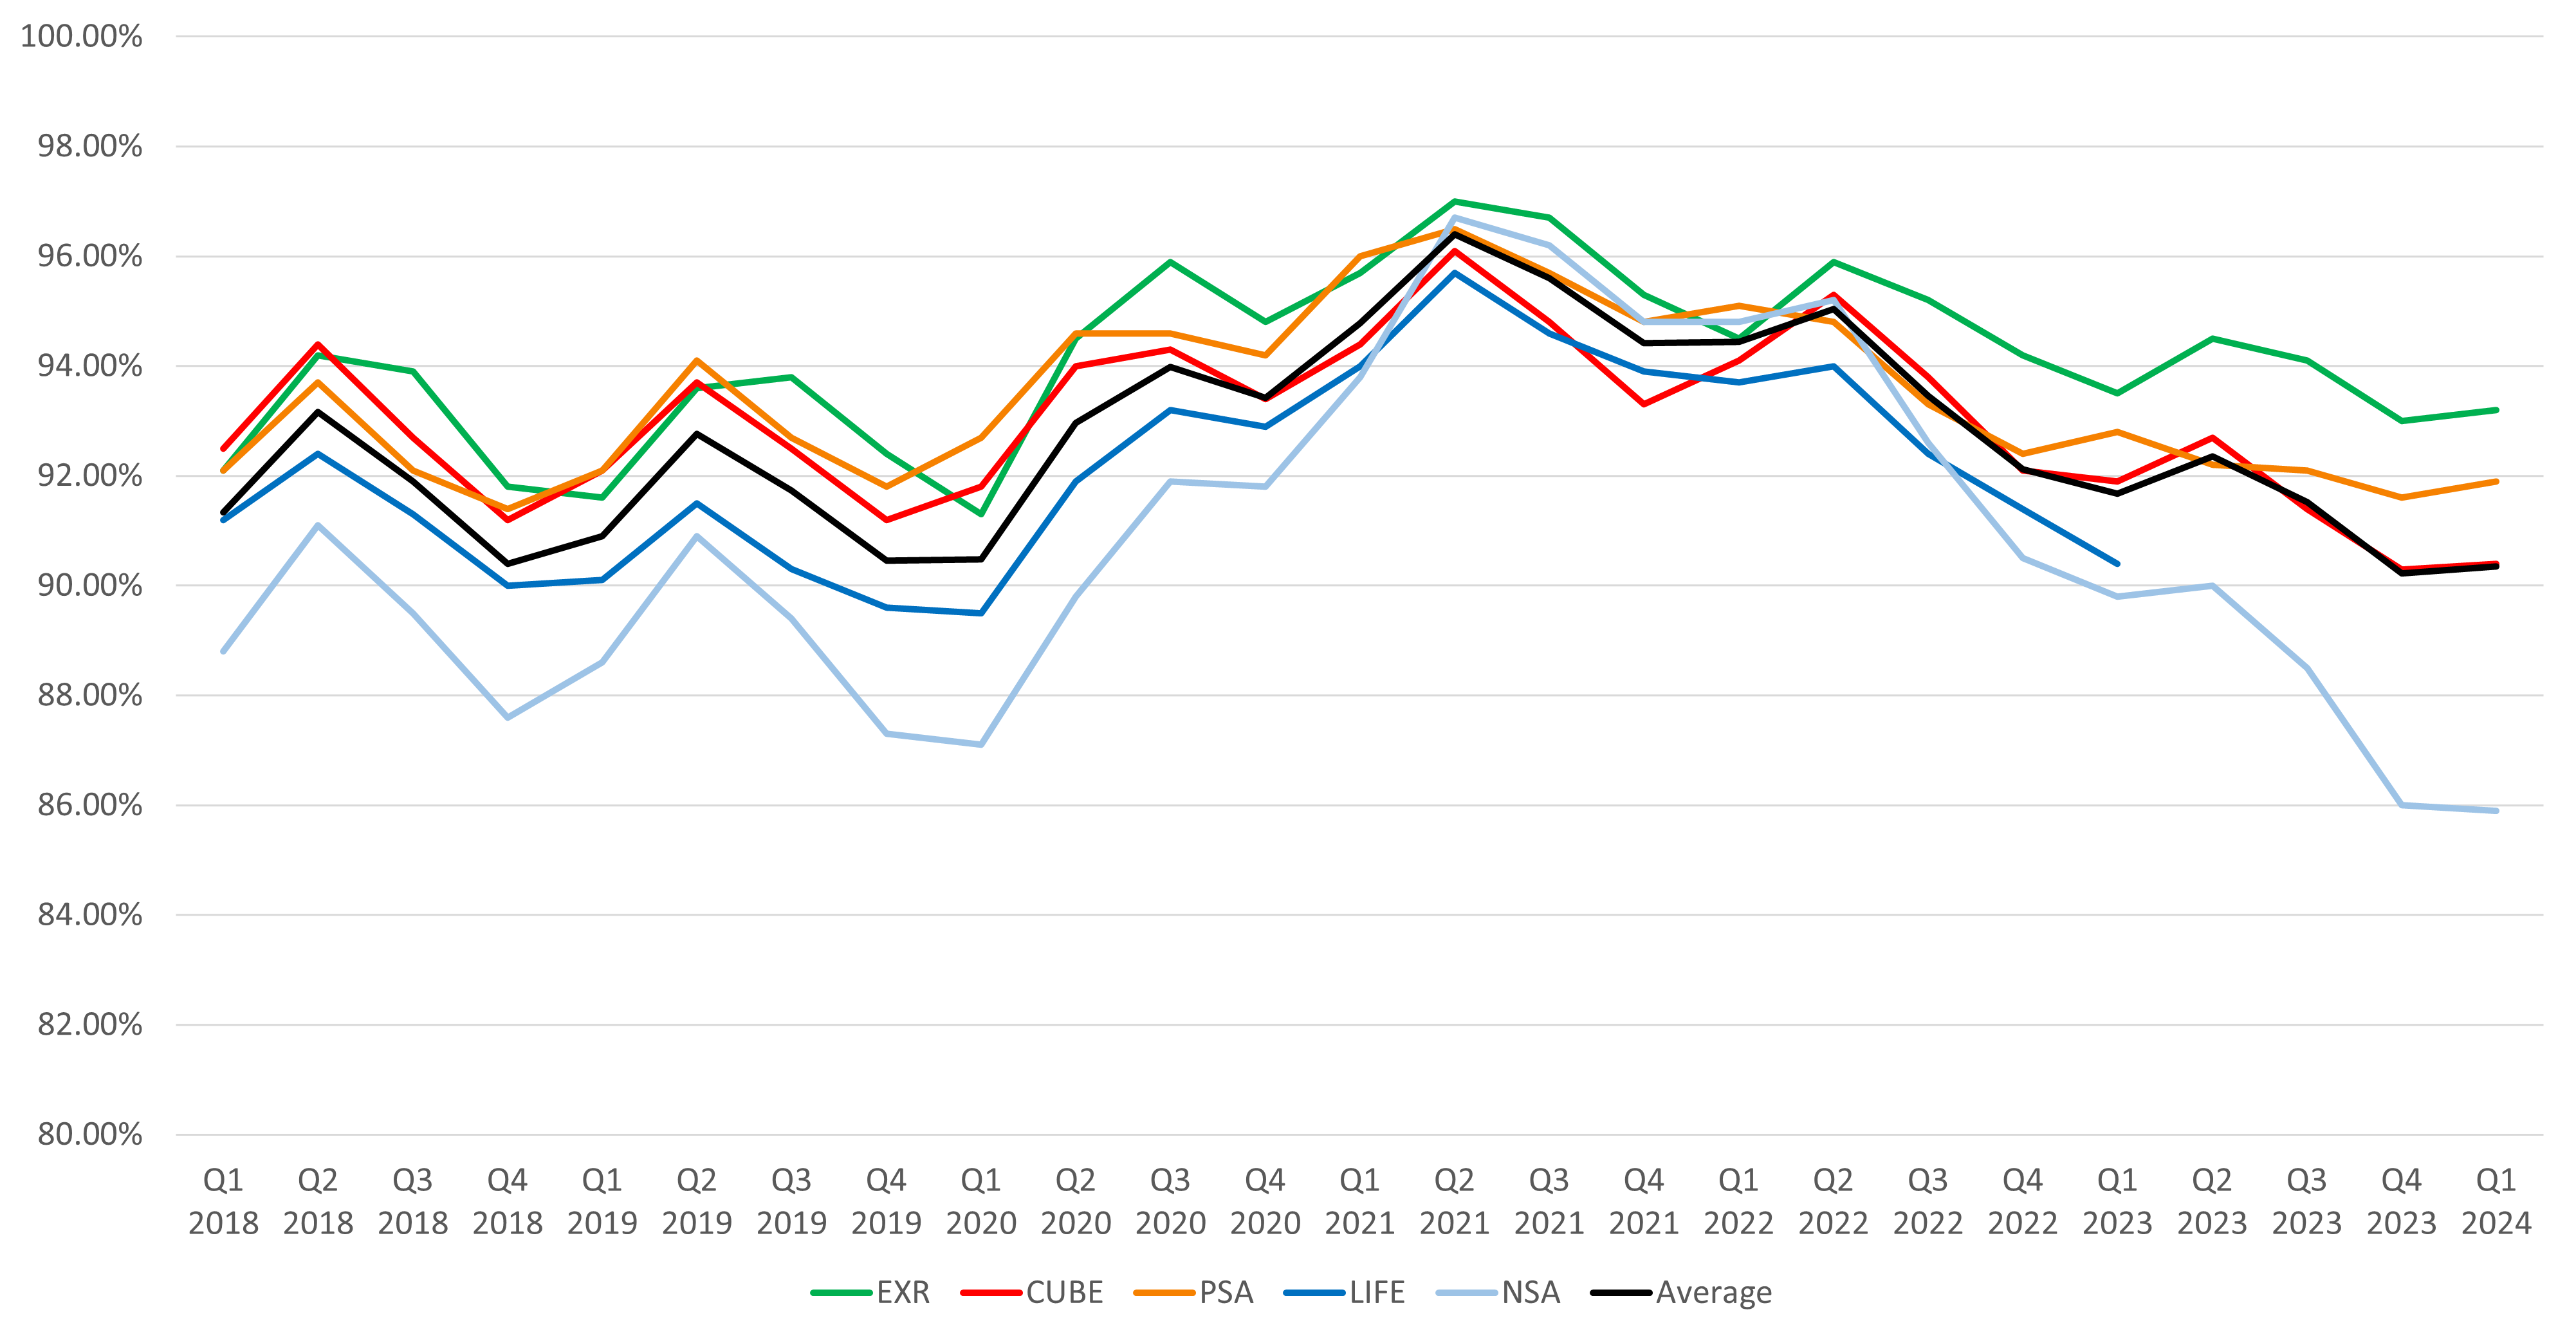
In the first quarter, Self Storage REITs implemented diverse strategies to manage occupancy levels, yielding varied outcomes. Extra Space and Life Storage showcased impressive sequential improvements, with Extra Space reaching a robust 93.2% occupancy and Legacy Life Storage achieving 92%, showcasing their market resilience and strategic positioning. CubeSmart encountered a slight decline in ending occupancy to 90.4% for its same-store portfolio, though stabilization was evident by April’s end at 90.8%. Despite challenges, CubeSmart remains cautiously optimistic, anticipating improvement with the onset of the crucial summer rental season. Public Storage faced modest occupancy declines but managed to narrow the gap through positive net move-in volumes, fostering optimism for the upcoming leasing season spanning May to July. Conversely, NSA saw a significant 350 basis point year-over-year decline on same store occupancies, ending the quarter at 85.9% occupancy. However, seasonal upticks partially offset this decline. Emphasizing operational enhancements and targeted customer acquisition strategies, all REITs are primed to navigate market dynamics, with an eye on the summer months for further occupancy improvements.
Self-Storage REITs - Period Ending Occupancy (Same Store)
Self-Storage Income & Expenses
During the first quarter of 2024, Self Storage REITs adeptly navigated income and expense dynamics amid a mix of challenges and strategic initiatives. Extra Space Storage demonstrated resilience in managing its finances, with a 5.5% year-over-year increase in same-store expenses, aligning with projections. Legacy Life Storage same-store properties saw a commendable 1.7% year-over-year revenue uptick, while expenses rose by 6.7%, primarily attributed to elevated payroll and repairs and maintenance costs aimed at addressing previously underinvested areas. Additionally, effective pay-per-click and search engine optimization strategies contributed positively to marketing expenditure returns. CubeSmart, despite witnessing stagnant same-store revenues, encountered a 5% surge in operating expenses, albeit mitigated by a noteworthy 15% reduction in advertising costs, owing to more efficient marketing approaches. Yet, CubeSmart anticipates potential increments in marketing spend throughout the year to sustain competitiveness. Public Storage, while experiencing modest revenue growth from rent escalations within the same store portfolio, encountered a noticeable rise in operating expenses, notably due to increased property taxes and augmented marketing expenditures aimed at fostering move-in activity. Meanwhile, NSA witnessed a 1.5% decline in revenue growth on a same-store basis, offset by a 2.4% growth in rent revenue per square foot, albeit challenged by a decrease in average occupancy. Operating expenses surged by 4.5%, predominantly fueled by spikes in property tax, marketing, and insurance expenses. Notably, payroll efficiencies offset some expense growth, underscoring a strategic balance. Amidst these intricacies, REITs remain adaptive, exploring diverse investment opportunities and transaction activities to navigate the dynamic market environment effectively.
Self-Storage Investment & Transaction Activity
In the realm of investment and transaction activity within the self-storage REIT sector, notable players have demonstrated resilience and strategic acumen amidst market challenges. Extra Space, exceeding projections, secured $164 million in new bridge loans, bolstering its capital-light external growth initiatives. Additionally, it augmented its portfolio by 97 third-party managed stores gross and 72 net, solidifying its leadership in third-party management. Despite a cautious transaction market, Extra Space strategically acquired six properties in Q1, including a C/O deal, showcasing proactive investment strategies. CubeSmart, recognizing the cautious investment landscape, completed the acquisition of a two-store portfolio in Connecticut for $20.2 million, reflecting a meticulous approach to acquisitions, with cap rates in the low sixes indicating stability. Public Storage outlined a robust investment strategy, projecting $450 million in development deliveries and aiming for $500 million in acquisitions during the latter half of the year, reflecting confidence in future transactions despite subdued volumes. National Storage Affiliates Trust, while refraining from acquisitions, remained active in evaluating potential transactions, completing over $200 million of common share buybacks during the quarter. Their target mid-6 cap rates for acquisitions and cautious approach to the bid-ask spread underscore a meticulous investment strategy. Exploring various options to maintain leverage and capitalize on opportunities, including potential share repurchases, reflects a nuanced understanding of market dynamics and risk management principles. Overall, these companies exhibit resilience and strategic foresight in navigating the intricate investment landscape of the self-storage REIT sector.
Self-Storage Cap Rates & Bid-Ask Spread
In terms of self-storage REITs, cap rates and bid-ask spreads serve as pivotal indicators of market health and investor sentiment. Across multiple companies, nuanced observations shed light on both stability and underlying uncertainty within the sector. Extra Space’s recent transactions revealed moderate cap rates, signaling a market characterized by stability yet constrained distress. EXR has stated that there is a noticeable bid-ask spread in the transaction market, particularly for larger portfolios. Meanwhile, CubeSmart’s acquisitions showcased cap rates in the low sixes, implying a robust and secure investment landscape. Public Storage’s stance reflects a readiness to engage in acquisitions pending optimal market conditions, amidst a backdrop of subdued transactional activity. National Storage Affiliates Trust (NSA) presents a comprehensive strategy, highlighting over $25 million under contract with target mid-6 cap rates. NSA’s approach underscores a cautious assessment of bid-ask spreads, signaling a disciplined pursuit of value amidst market volatility. In sum, while specifics may vary, a collective emphasis on vigilance, strategic maneuvering, and readiness characterizes the approach of these self-storage REITs in navigating the intricacies of cap rates and bid-ask spreads.
Self-Storage REIT Implied Cap Rate History
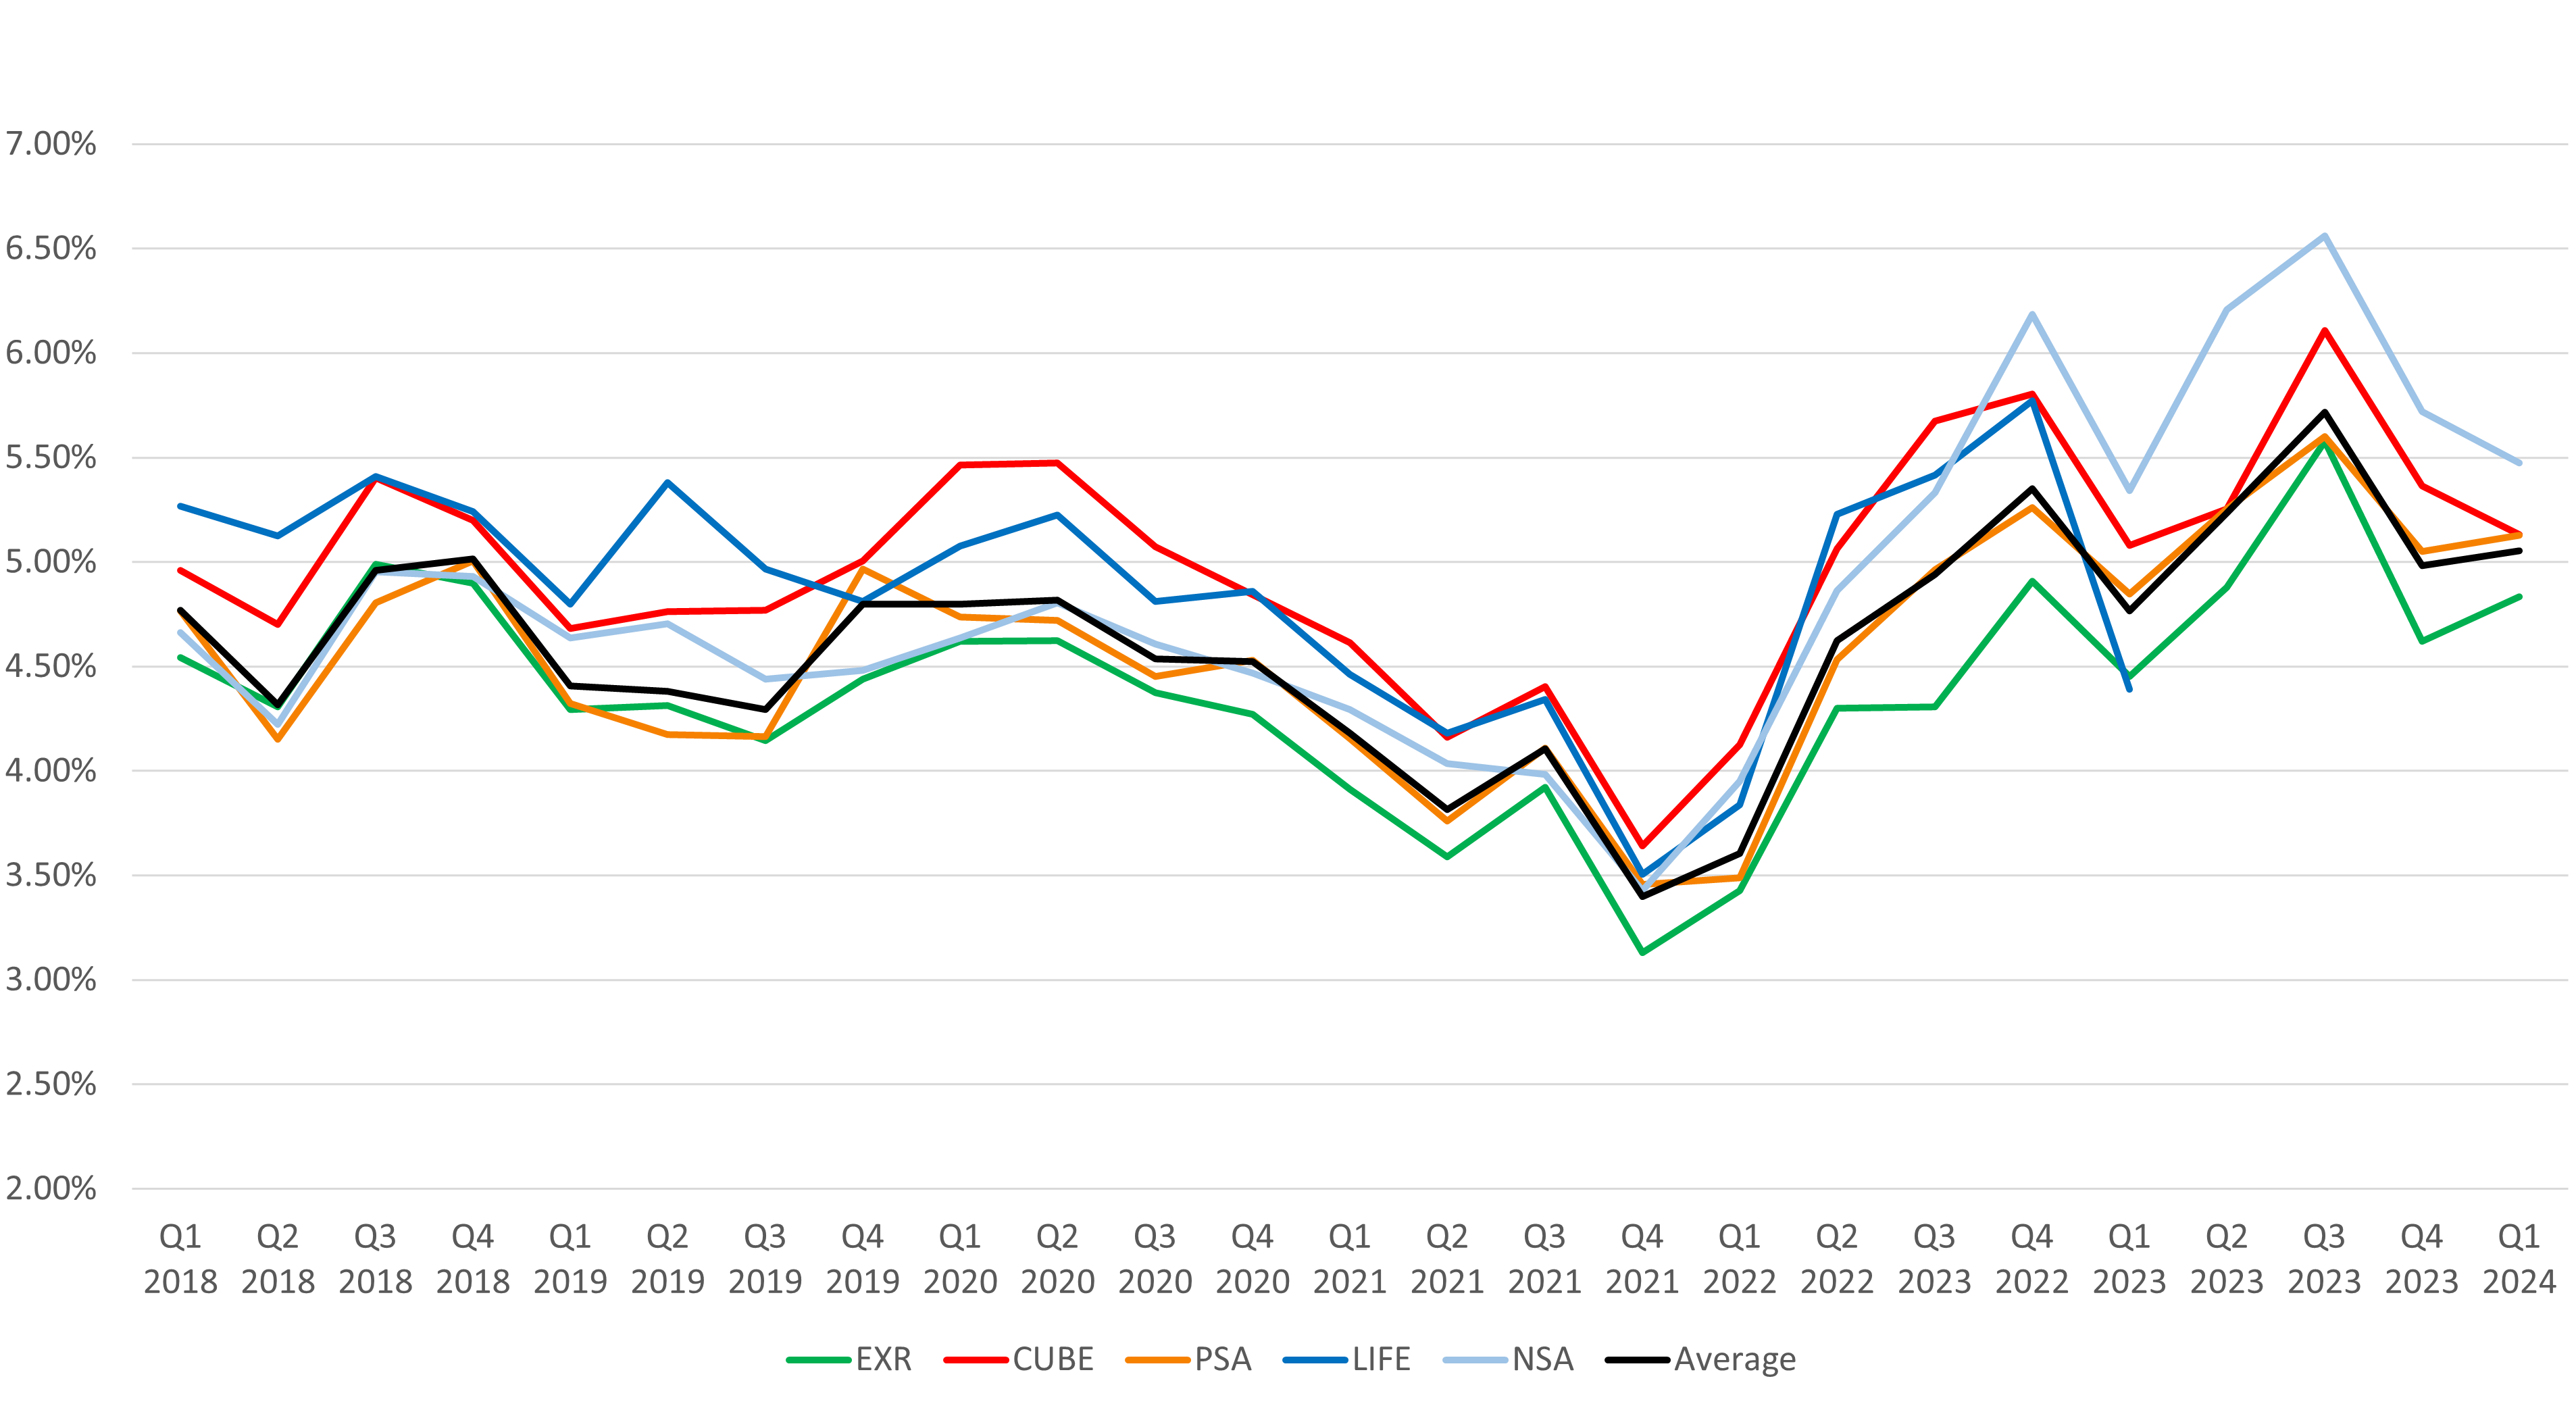
*The implied cap rate data indicates the market value of each REIT.
The implied capitalization rate is a culmination of the company value and total debt of each company divided by its NOI.
Tailwinds in the Self-Storage Market
The self-storage Real Estate Investment Trust (REIT) sector is navigating various market dynamics with optimism fueled by notable tailwinds. Extra Space Storage is buoyed by successes in capital-light growth initiatives and operational efficiency gains, bolstered by diversification across resilient markets such as Houston and Chicago, experiencing strong population growth and business migration. CubeSmart reports robust demand in urban centers like New York, Boston, and San Diego, leveraging technological advancements to enhance marketing efficiency and capitalize on declining new supply trends, particularly in markets like North Jersey and Philadelphia. Public Storage highlights positive market trends, including improved customer demand and occupancy metrics, positioning the company for sustained growth in key markets. Despite challenges, NSA remains bullish on Sunbelt markets, eyeing acquisitions to enhance portfolio quality and operational efficiency while adapting marketing strategies to meet evolving consumer price sensitivity.
Headwinds in the Self-Storage Market
Headwinds persist across the self-storage REIT market as companies grapple with muted transaction activity, affordability concerns, and escalating operating expenses. Extra Space Storage remains confident in its adaptive strategies to navigate challenges, emphasizing the role of technology in optimizing operations. CubeSmart faces challenges from volatile macroeconomic conditions, including flat or slightly declining rents in Sunbelt markets and limited M&A opportunities. Despite these, it focuses on leveraging its operational platform for stability and seizing opportunities. Public Storage acknowledges competitive pressures and escalating expenses, with subdued transactional activity posing growth challenges. Meanwhile, certain Sunbelt markets report revenue below average due to factors like new supply absorption and competitive pricing, prompting a focus on delivering superior customer experiences and strategic market positioning for sustained growth.
Q1 2024 Self-Storage REIT Data by MSA
| Average Occupancy Same Store | Achieved Rate Same Store | |||||||||||
| EXR | CUBE | PSA | NSA | Average | EXR | CUBE | PSA | NSA | Average | |||
| Atlanta, GA | 93.30% | 89.10% | 87.20% | 81.20% | 87.70% | Atlanta, GA | $18.02 | $17.05 | $17.91 | $14.58 | $16.89 | |
| Austin, TX | 93.20% | 88.20% | - | 84.80% | 88.73% | Austin, TX | $18.19 | $18.31 | - | $16.85 | $17.78 | |
| Baltimore, MD | - | 92.30% | 90.80% | - | 91.55% | Baltimore, MD | - | $22.24 | $23.55 | - | $22.90 | |
| Boston, MA | 93.90% | 88.00% | - | - | 90.95% | Boston, MA | $27.86 | $25.76 | - | - | $26.81 | |
| Bridgeport, CT | - | 90.00% | - | - | 90.00% | Bridgeport, CT | - | $29.78 | - | - | $29.78 | |
| Brownsville, TX | - | - | - | 90.70% | 90.70% | Brownsville, TX | - | - | - | $13.31 | $13.31 | |
| Charleston, SC | 94.30% | 90.70% | - | - | 92.50% | Charleston, SC | $17.68 | $16.41 | - | - | $17.05 | |
| Charlotte, NC | - | 89.00% | 90.80% | - | 89.90% | Charlotte, NC | - | $18.17 | $16.09 | - | $17.13 | |
| Chicago, IL | 92.40% | 91.30% | 92.00% | - | 91.90% | Chicago, IL | $20.31 | $19.29 | $20.37 | - | $19.99 | |
| Cincinnati, OH | 93.90% | - | - | - | 93.90% | Cincinnati, OH | $13.73 | - | - | - | $13.73 | |
| Cleveland, OH | - | 86.50% | - | - | 86.50% | Cleveland, OH | - | $17.62 | - | - | $17.62 | |
| Colorado Springs, CO | - | - | - | 83.70% | 83.70% | Colorado Springs, CO | - | - | - | $13.68 | $13.68 | |
| Columbus, OH | 91.00% | 89.80% | - | - | 90.40% | Columbus, OH | $12.49 | $13.85 | - | - | $13.17 | |
| Dallas, TX | 94.10% | 91.90% | 89.50% | 84.40% | 89.98% | Dallas, TX | $18.20 | $18.17 | $18.28 | $14.20 | $17.21 | |
| Washington DC | 94.10% | 91.00% | 91.60% | - | 92.23% | Washington DC | $23.66 | $25.56 | $26.62 | - | $25.28 | |
| Denver, CO | 94.20% | 91.30% | - | - | 92.75% | Denver, CO | $17.83 | $18.31 | - | - | $18.07 | |
| Ft Myers, FL | - | 87.10% | - | - | 87.10% | Ft Myers, FL | - | $22.09 | - | - | $22.09 | |
| Hawaii, HI | 93.30% | - | - | - | 93.30% | Hawaii, HI | $45.29 | - | - | - | $45.29 | |
| Hartford, CT | - | 91.20% | - | - | 91.20% | Hartford, CT | - | $17.74 | - | - | $17.74 | |
| Houston, TX | 93.50% | 90.70% | 90.80% | 87.70% | 90.68% | Houston, TX | $16.96 | $17.26 | $16.89 | $12.89 | $16.00 | |
| Indianapolis. IN | 89.10% | - | - | - | 89.10% | Indianapolis. IN | $12.09 | - | - | - | $12.09 | |
| Jacksonville, FL | - | 91.80% | - | - | 91.80% | Jacksonville, FL | - | $20.56 | - | - | $20.56 | |
| Las Vegas, NV | 94.50% | 90.10% | - | 86.90% | 90.50% | Las Vegas, NV | $17.29 | $19.33 | - | $14.51 | $17.04 | |
| Los Angeles, CA | 93.60% | 90.50% | 95.30% | 86.70% | 91.53% | Los Angeles, CA | $29.92 | $27.65 | $35.66 | $24.85 | $29.52 | |
| Memphis, TN | 92.40% | - | - | - | 92.40% | Memphis, TN | $12.44 | - | - | - | $12.44 | |
| McAllen, TX | - | - | - | 89.90% | 89.90% | McAllen, TX | - | - | - | $13.72 | $13.72 | |
| Miami, FL | 94.00% | 92.10% | 93.80% | - | 93.30% | Miami, FL | $27.62 | $25.56 | $29.60 | - | $27.59 | |
| Nashville, TN | - | 88.70% | - | - | 88.70% | Nashville, TN | - | $16.16 | - | - | $16.16 | |
| New Orleans, LA | - | - | - | 82.00% | 82.00% | New Orleans, LA | - | - | - | $15.16 | $15.16 | |
| New York, NY | 93.20% | 90.90% | 93.70% | - | 92.60% | New York, NY | $29.81 | $36.93 | $31.90 | - | $32.88 | |
| Norfolk, VA | 91.70% | - | - | - | 91.70% | Norfolk, VA | $18.57 | - | - | - | $18.57 | |
| Oklahoma City, OK | - | - | - | 86.50% | 86.50% | Oklahoma City, OK | - | - | - | $11.02 | $11.02 | |
| Orlando, FL | 92.30% | 90.30% | 91.40% | - | 91.33% | Orlando, FL | $17.81 | $17.69 | $19.05 | - | $18.18 | |
| Philadelphia, PA | 90.30% | 89.90% | 92.10% | - | 90.77% | Philadelphia, PA | $21.39 | $21.26 | $21.21 | - | $21.29 | |
| Phoenix, AZ | 93.90% | 88.50% | - | 83.90% | 88.77% | Phoenix, AZ | $17.35 | $17.16 | - | $16.16 | $16.89 | |
| Portland. OR | 95.70% | - | - | 85.80% | 90.75% | Portland. OR | $19.32 | - | - | $19.12 | $19.22 | |
| Providence, RI | - | 91.40% | - | - | 91.40% | Providence, RI | - | $20.16 | - | - | $20.16 | |
| Richmond, VA | 94.00% | - | - | - | 94.00% | Richmond, VA | $18.23 | - | - | - | $18.23 | |
| Riverside, CA | - | 89.10% | - | 86.10% | 87.60% | Riverside, CA | - | $19.53 | - | $16.45 | $17.99 | |
| Sacramento, CA | 93.80% | 90.50% | - | - | 92.15% | Sacramento, CA | $20.51 | $18.05 | - | - | $19.28 | |
| San Antonio, TX | - | 86.70% | - | 82.60% | 84.65% | San Antonio, TX | - | $17.22 | - | $15.61 | $16.42 | |
| San Diego, CA | - | 91.40% | - | - | 91.40% | San Diego, CA | - | $26.16 | - | - | $26.16 | |
| San Francisco, CA | 94.40% | - | 94.80% | - | 94.60% | San Francisco, CA | $34.68 | - | $31.88 | - | $33.28 | |
| Sarasota, FL | - | - | - | 84.40% | 84.40% | Sarasota, FL | - | - | - | $22.04 | $22.04 | |
| Seattle, WA | - | - | 92.80% | - | 92.80% | Seattle, WA | - | - | $25.12 | - | $25.12 | |
| Tampa, FL | 92.90% | 89.70% | - | - | 91.30% | Tampa, FL | $20.46 | $20.76 | - | - | $20.61 | |
| Tucson, AZ | - | 88.70% | - | - | 88.70% | Tucson, AZ | - | $17.06 | - | - | $17.06 | |
| Tulsa, OK | - | - | - | 85.50% | 85.50% | Tulsa, OK | - | - | - | $11.41 | $11.41 | |
| West Palm Beach, FL | - | - | 92.80% | - | 92.80% | West Palm Beach, FL | - | - | $25.97 | - | $25.97 | |
| Other | 93.50% | 88.50% | 92.00% | 85.20% | 89.80% | Other | $17.63 | $19.31 | $18.41 | $15.37 | $17.68 | |
| Total | 93.10% | 90.20% | 92.10% | 85.60% | 90.25% | Total | $21.62 | $22.66 | $22.53 | $15.80 | $20.65 | |