
Self-Storage REIT Highlights
- CubeSmart saw a 9.8% drop in asking rental rates by the end of June 2024, reflecting the competitive pressures in the market.
- Occupancy decreased by 70 basis points year-over-year, ending Q2 at 91.9% on its same-store pool, reflecting challenges in maintaining occupancy amidst declining rates.
- Continued to focus on growth through its third-party management platform, adding 39 stores and opening two new projects in New York with a total investment of $61.8 million.
- Extra Space reported a 12% improvement in average move-in rates; however, this was still 8% below the previous year’s average, highlighting the pressure on rental pricing.
- Experienced a 20 basis point decline in same-store occupancy year-over-year, finishing the quarter at 94.3%, indicating resilience but also pressure from market conditions.
- Faced a 6% increase in same-store expenses, which, combined with pressures on rental rates, has impacted overall income growth.
- NSA faced pricing challenges, particularly in oversupplied markets, leading to heightened price sensitivity among new customers, but managed a modest 2.6% increase in same-store achieved rates year-over-year.
- Saw a 3% decline in same-store occupancy year-over-year, with the company noting a shift in peak occupancy seasons to earlier in the year, signaling changing market dynamics.
- NSA’s investment activity was cautious, focusing more on internal growth and redevelopment rather than external acquisitions, largely due to the wide bid-ask spread in the market.
- Public Storage experienced a significant 14% decline in move-in rental rates compared to the previous year, prompting the company to revise its revenue guidance downward.
- Despite pressures on rental rates, Public Storage achieved a positive net move-in trend, narrowing its same-store occupancy gap by 50 basis points and ending Q2 with strong performance in its non-same-store pool, which reached 83% occupancy.
- Public Storage reported a 1.1% decline in same-store rental revenue and a 2% drop in NOI due to a 90 basis point increase in operating costs, yet it maintained a strong operating margin at 79%.
Thoughts from the CEO's
CubeSmart
Christopher P. Marr
President & Chief Executive Officer
“Despite the pressures on rental rates, we continue to see strong demand in our key markets. Our expanding third-party management platform remains a critical growth driver, providing stable income even as market conditions fluctuate.”
Extra Space Storage
Joseph D. Margolis
Chief Executive Officer
“While we have faced challenges with declining move-in rates, our focus remains on optimizing our existing portfolio and enhancing customer service to drive long-term value. The recent improvement in average move-in rates, though still below last year’s levels, reflects our commitment to balancing pricing and occupancy.”
National Storage Affiliates
David Cramer
President & Chief Executive Officer
“We are navigating a challenging market environment with a focus on internal growth and redevelopment. While external acquisitions have slowed due to a wide bid-ask spread, our strategic cost management and strong capital position allow us to weather these headwinds effectively.”
Public Storage
Joseph D. Russell, Jr
President, Chief Executive Officer
“Our ability to narrow the occupancy gap and achieve a positive net move-in trend this quarter is a testament to our strategic approach. We remain committed to investing in high-growth markets and maintaining our strong operational margins, even in the face of rising expenses.”
Macroeconomic Highlights
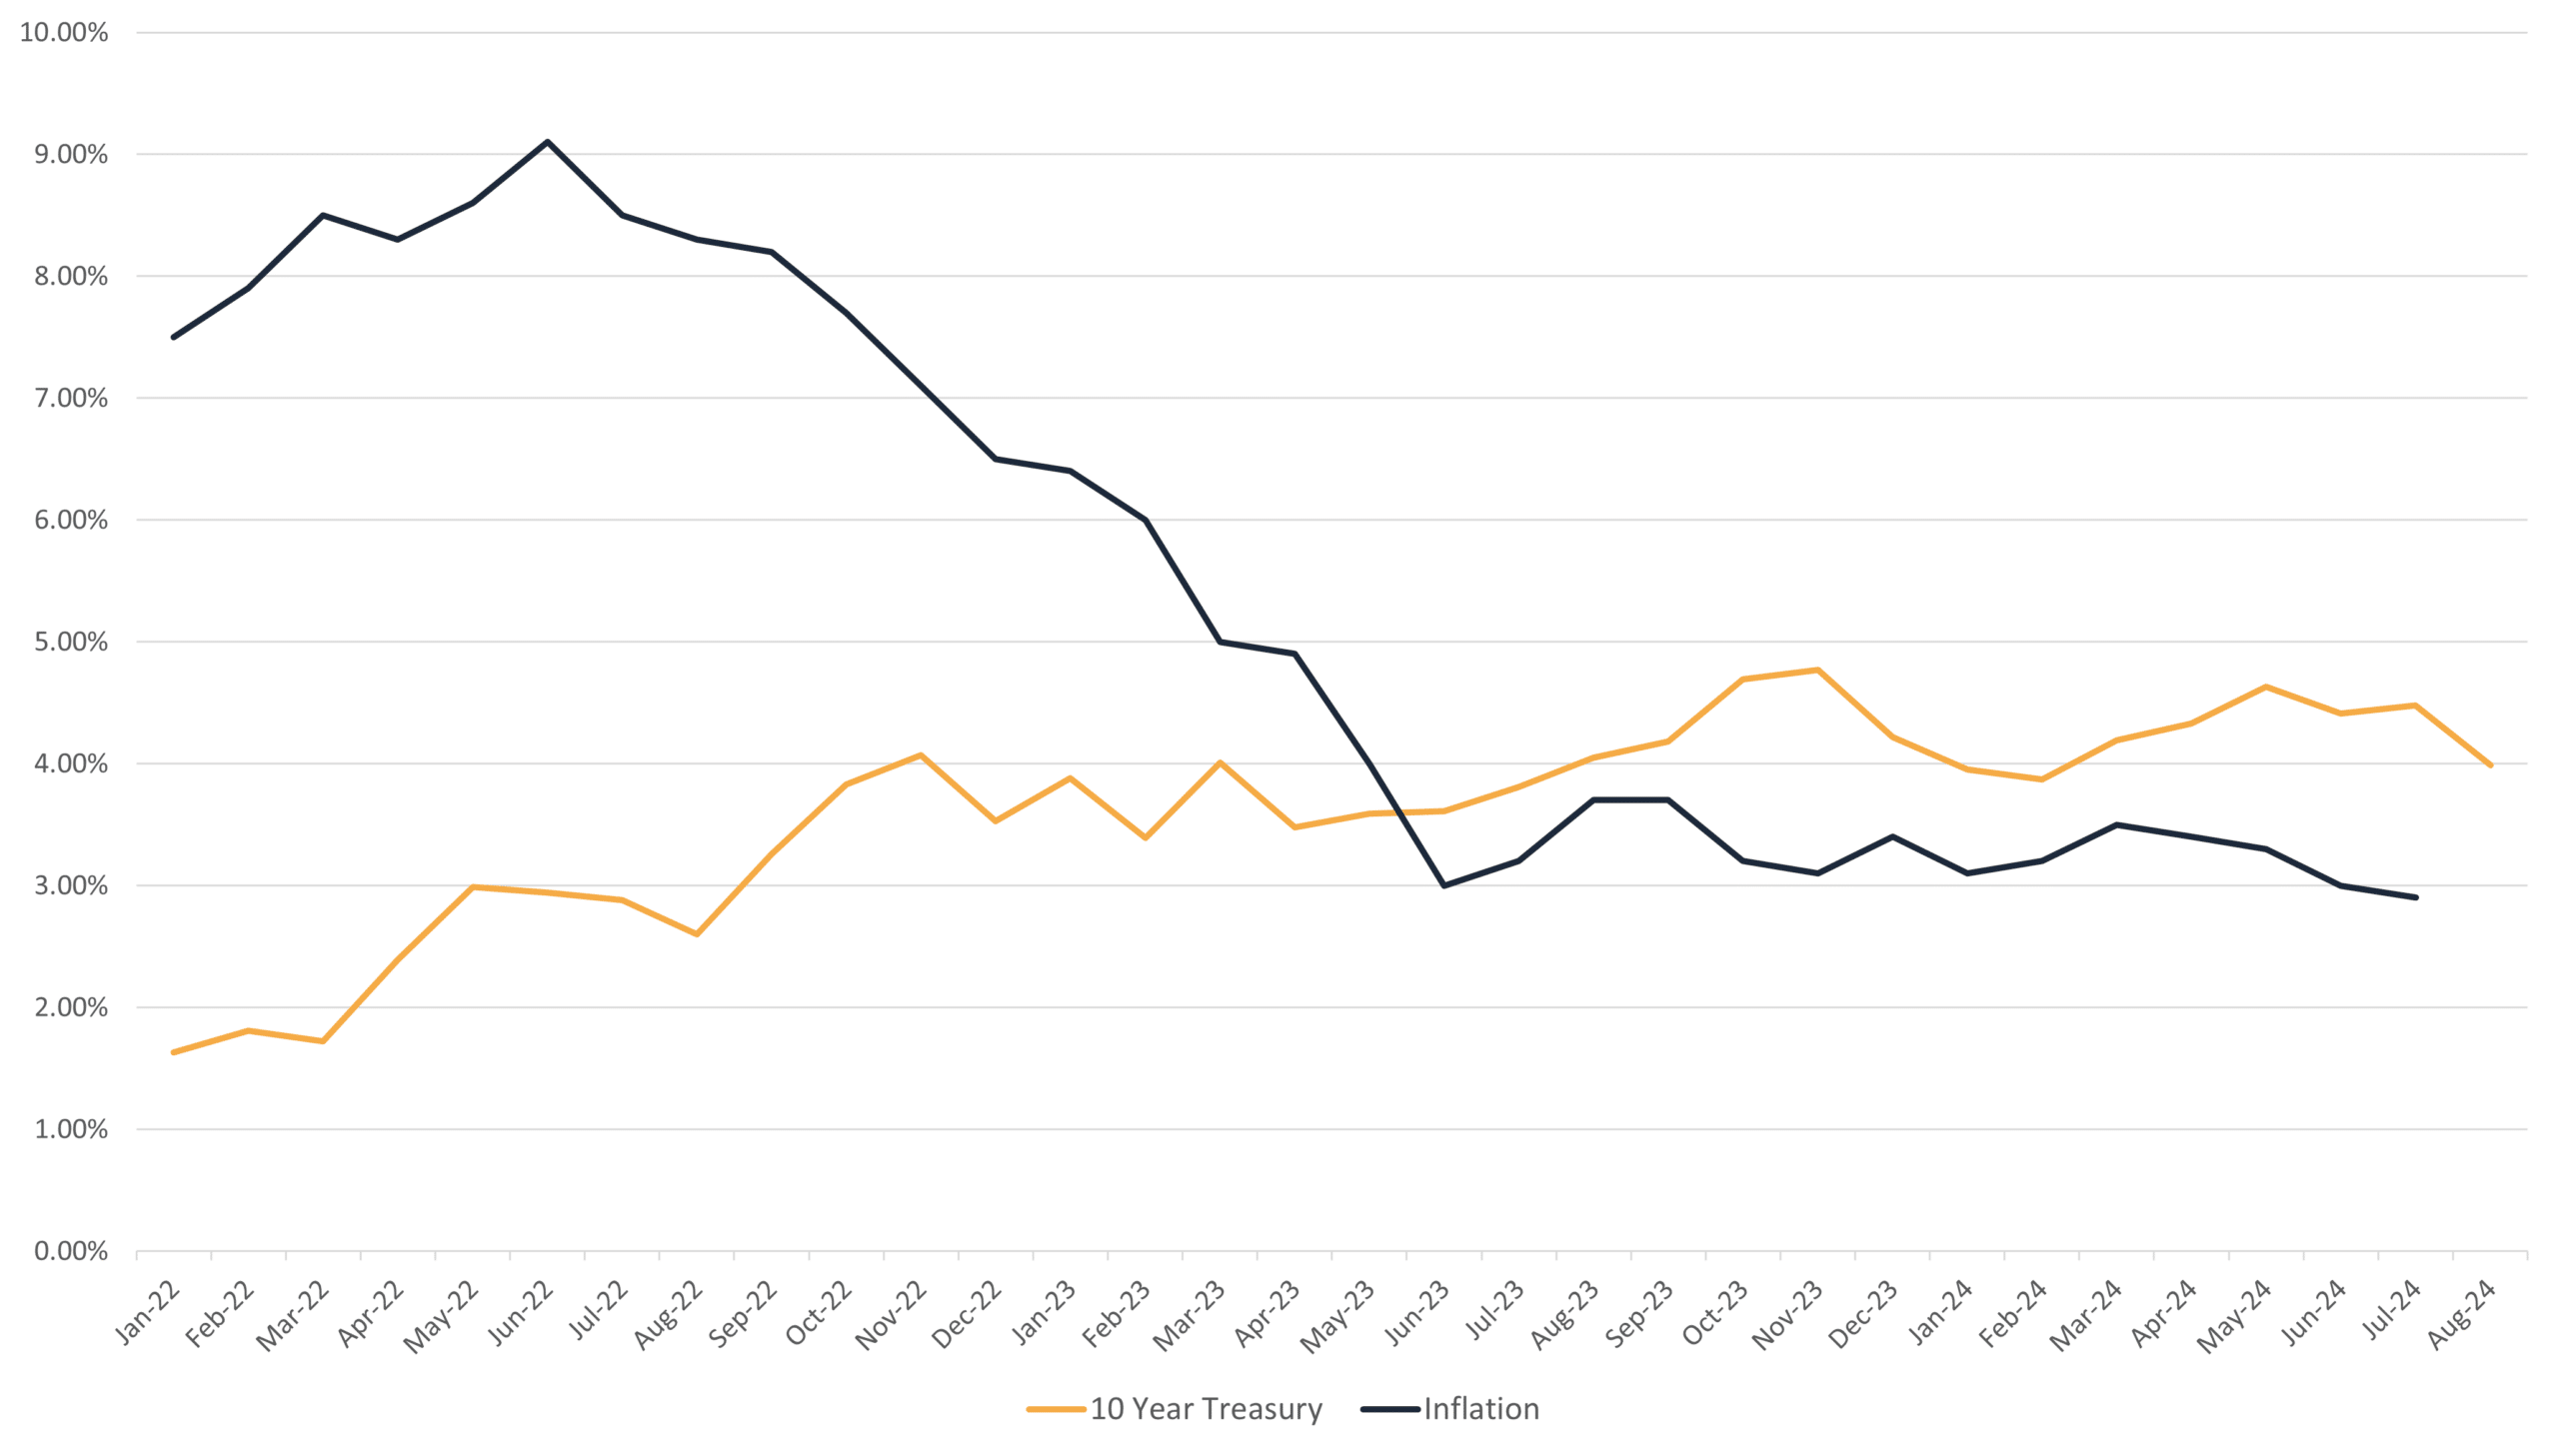
Recession Fears and Economic Outlook: Economic uncertainty remains a significant concern as the U.S. navigates the possibility of a recession. While GDP growth has been positive, the Federal Reserve’s interest rate hikes aimed at curbing inflation have led to concerns about a potential economic slowdown. Consumer spending has been resilient but is expected to weaken as pandemic-era savings dwindle and borrowing costs rise. Meanwhile, the labor market remains strong, but there are signs of stress, including rising delinquencies in subprime loans and the potential impact of restarting student loan payments.
Geopolitical Tensions and Their Impact: The upcoming election is likely to significantly influence the commercial real estate market as potential policy shifts could affect key areas such as taxation, regulation, and federal spending. Issues like corporate tax rates, environmental regulations, and infrastructure investment are particularly crucial for sectors like industrial, office, and multifamily properties. As the election approaches, market participants may adopt a cautious stance, leading to temporary uncertainty and slowed transaction activity. Additionally, the election’s outcome could impact interest rate policy and economic stimulus measures, both of which are vital to commercial real estate investment and development.
Inflation and the 10-Year Treasury Since 2022
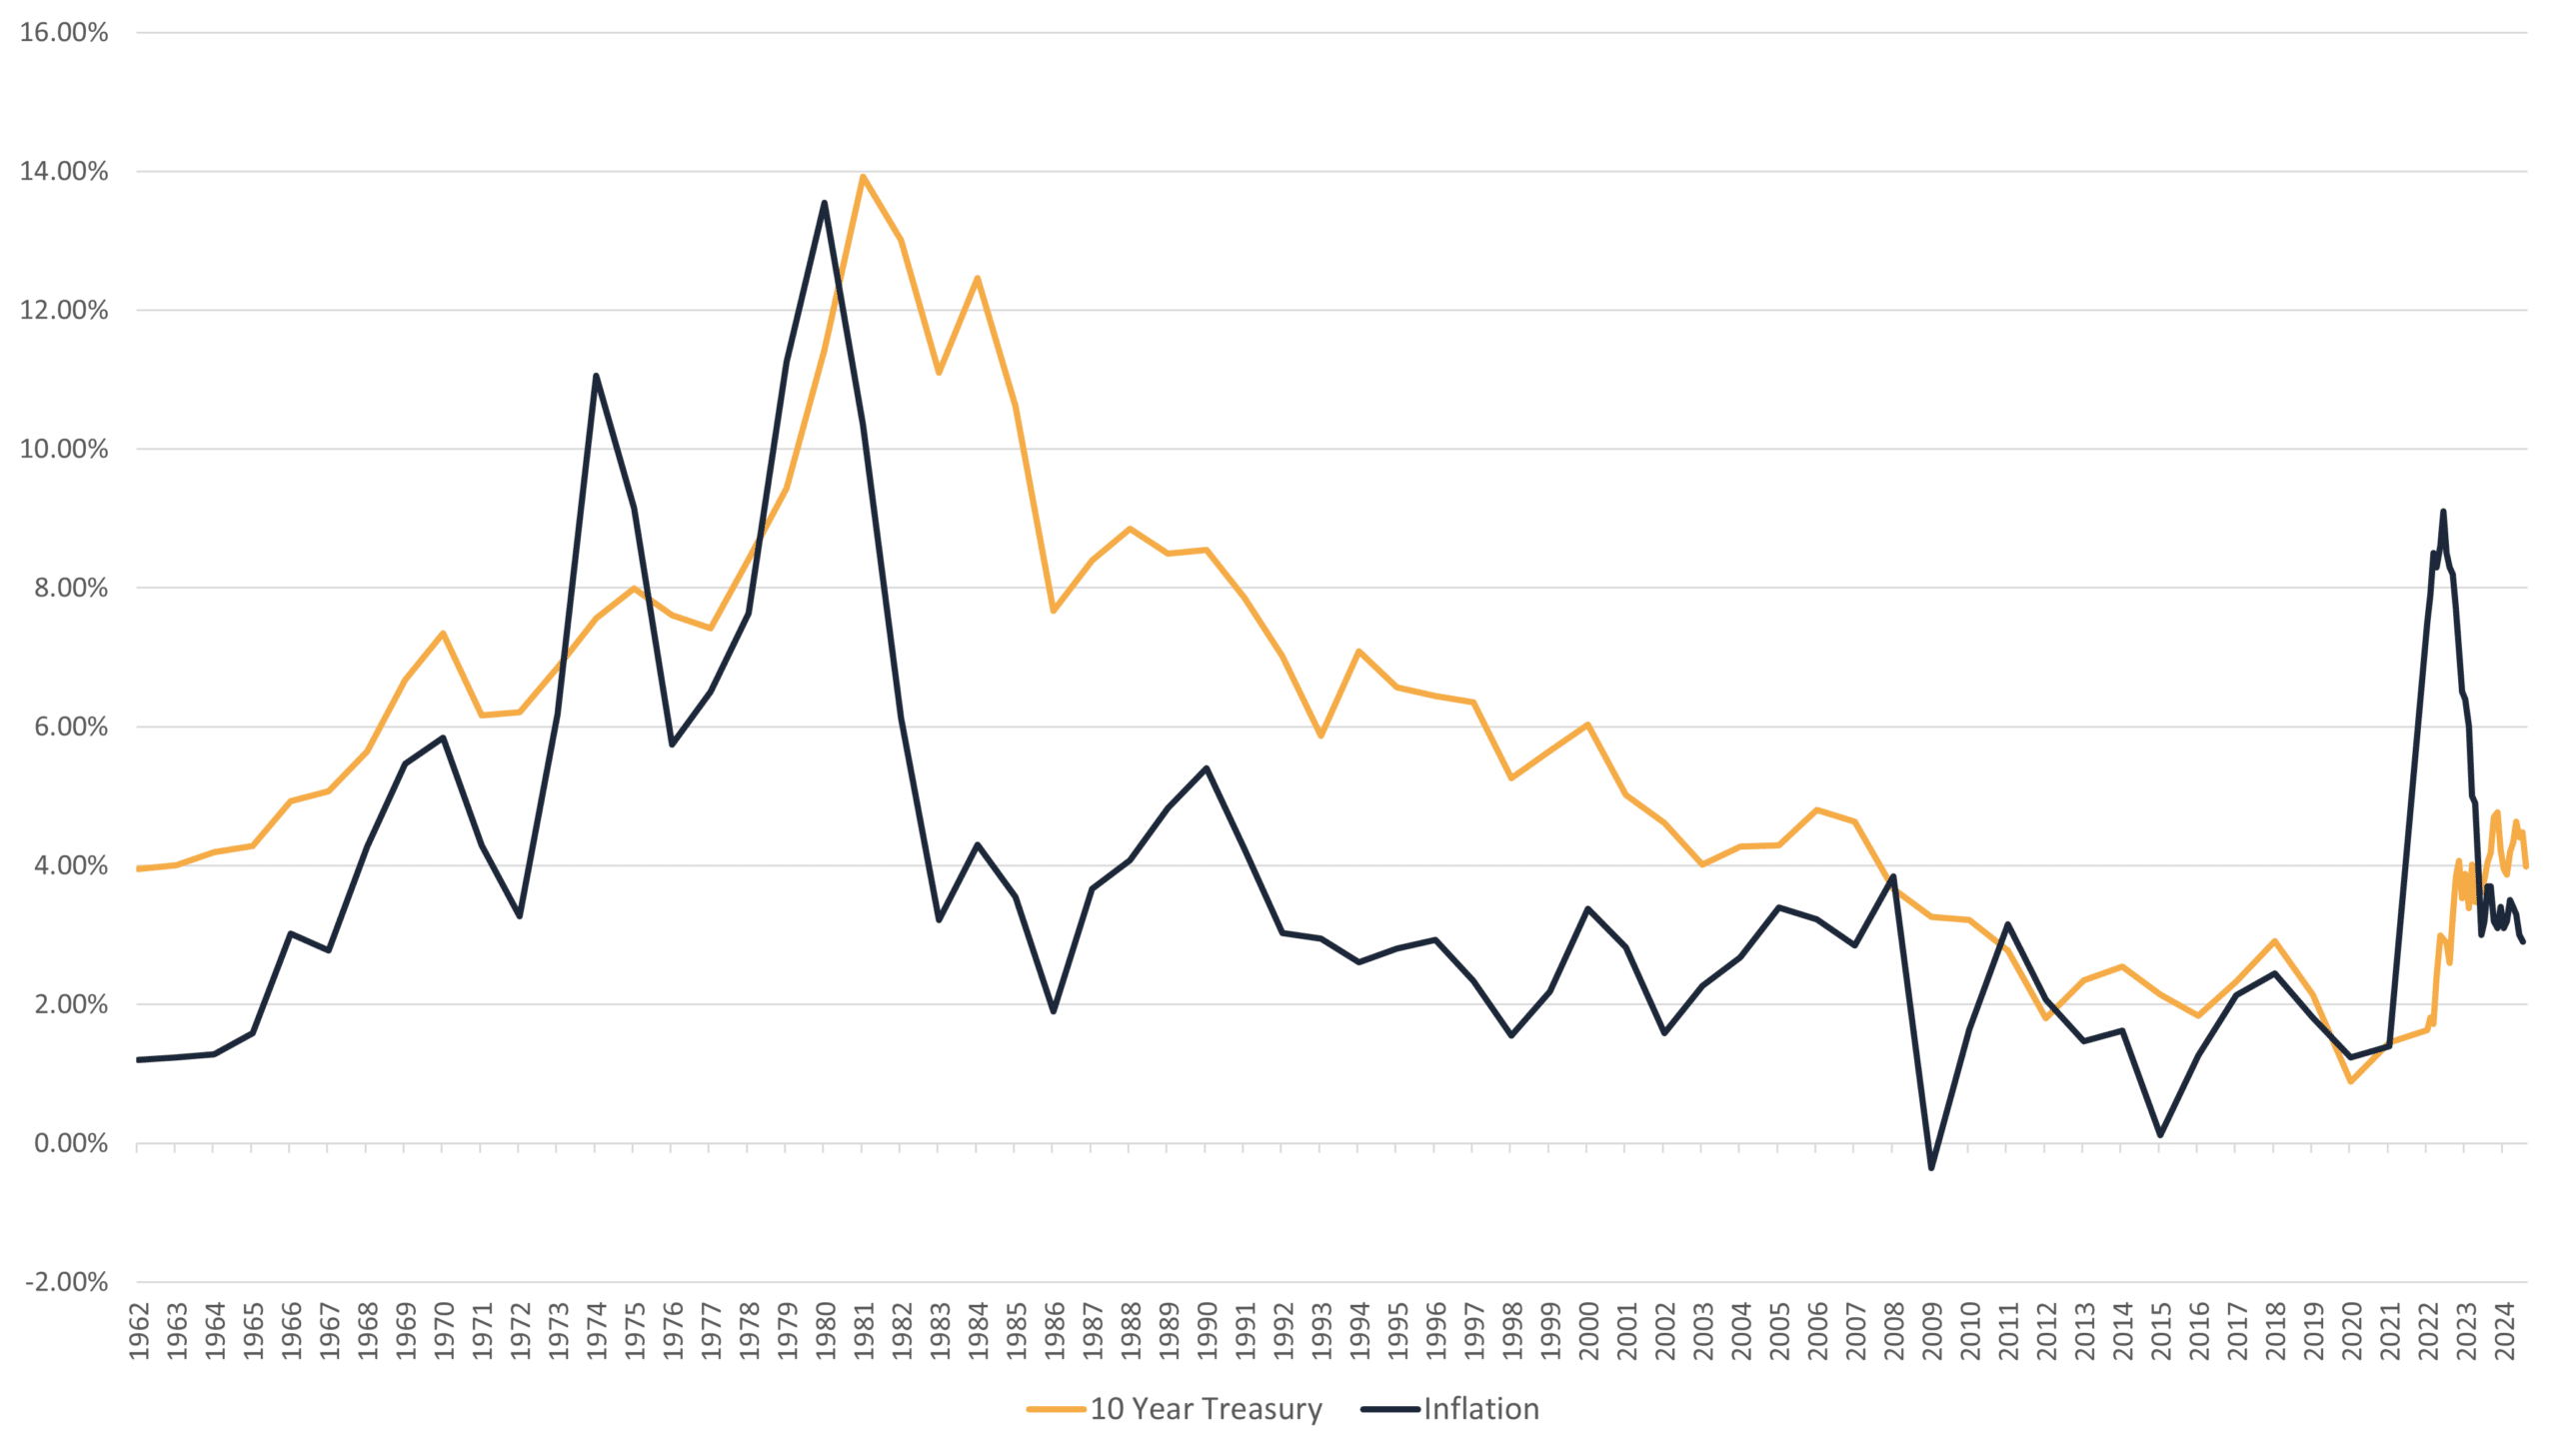
Inflation and the 10-Year Treasury Since 1962
Q2 2024 Self-Storage REIT Data Overview
| Same Store Ending Occupancy | Same Store YoY Rental Income Increase | Same Store YoY Expense Increase | Same Store YoY NOI Increase | Same Store Achieved Rate | Q2 Acquisitions | ||||||||
| 2024 | 2023 | 2024 | 2023 | 2024 | 2023 | 2024 | 2023 | 2024 | 2023 | % Change | 2024 | 2023 | |
| CUBE | 91.90% | 92.60% | -0.30% | 4.10% | 4.20% | 3.60% | -1.20% | 5.00% | $23.40 | $23.12 | 1.2% | 0 | 0 |
| EXR | 94.30% | 94.50% | 0.70% | 2.40% | 6.00% | 3.00% | -1.10% | 2.60% | $21.63 | $22.62 | -4.4% | 3 | 3 |
| NSA | 87.00% | 90.00% | -2.83% | 2.47% | 4.80% | 1.40% | -5.60% | 3.40% | $15.66 | $15.27 | 2.6% | 3 | 2 |
| PSA | 92.70% | 93.20% | -1.10% | 6.00% | 2.60% | 6.70% | -2.00% | 6.20% | $22.72 | $23.34 | -2.7% | 2 | 11 |
Q2 2024 Self-Storage Operating Fundamentals
Self-Storage Rental Rates
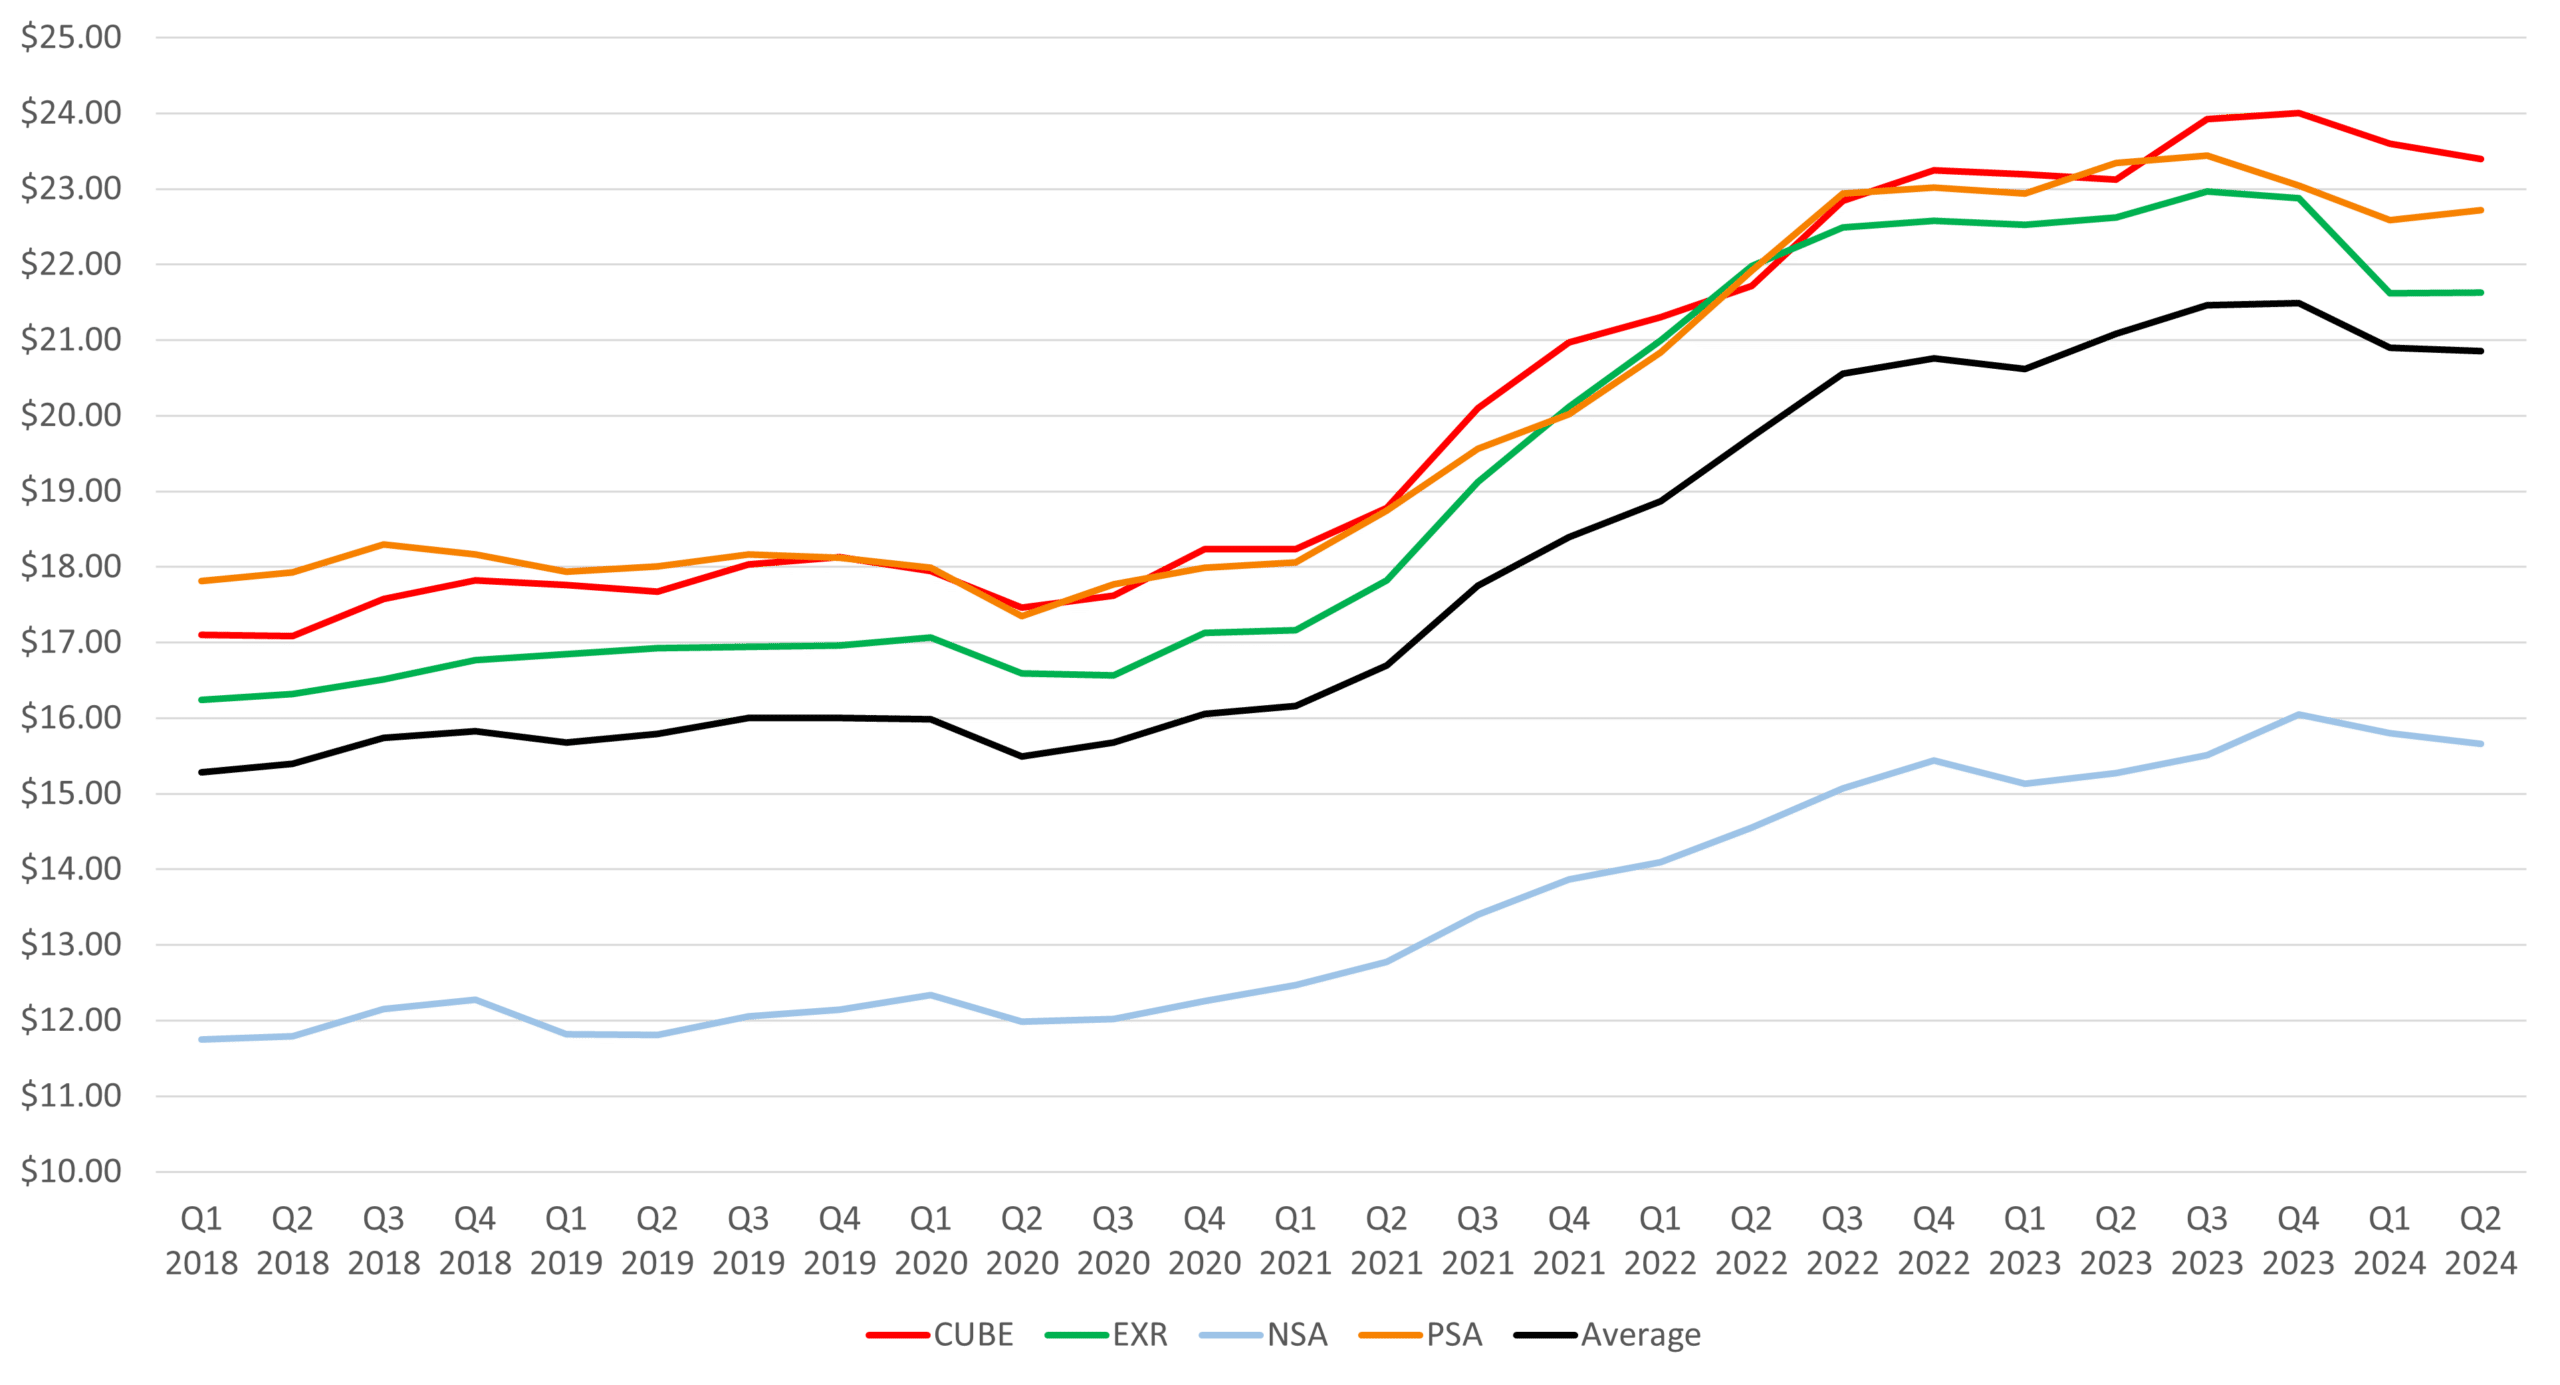
Rental rates have been under substantial pressure across all REITs. Public Storage reported a 14% decline in move-in rents compared to the previous year, which prompted a revision of revenue guidance. CubeSmart noted a similar trend, with asking rates dropping by 9.8% by the end of June 2024. Extra Space saw an average move-in rate improvement of 12%, but this was still about 8% below last year’s average. NSA reported pricing challenges, particularly in markets with oversupply, leading to heightened price sensitivity among new customers. Same store YoY achieved rates are down 4.4% and 2.7% for EXR and Public respectively and up 1.2% and 2.6% for Cube and NSA respectively.
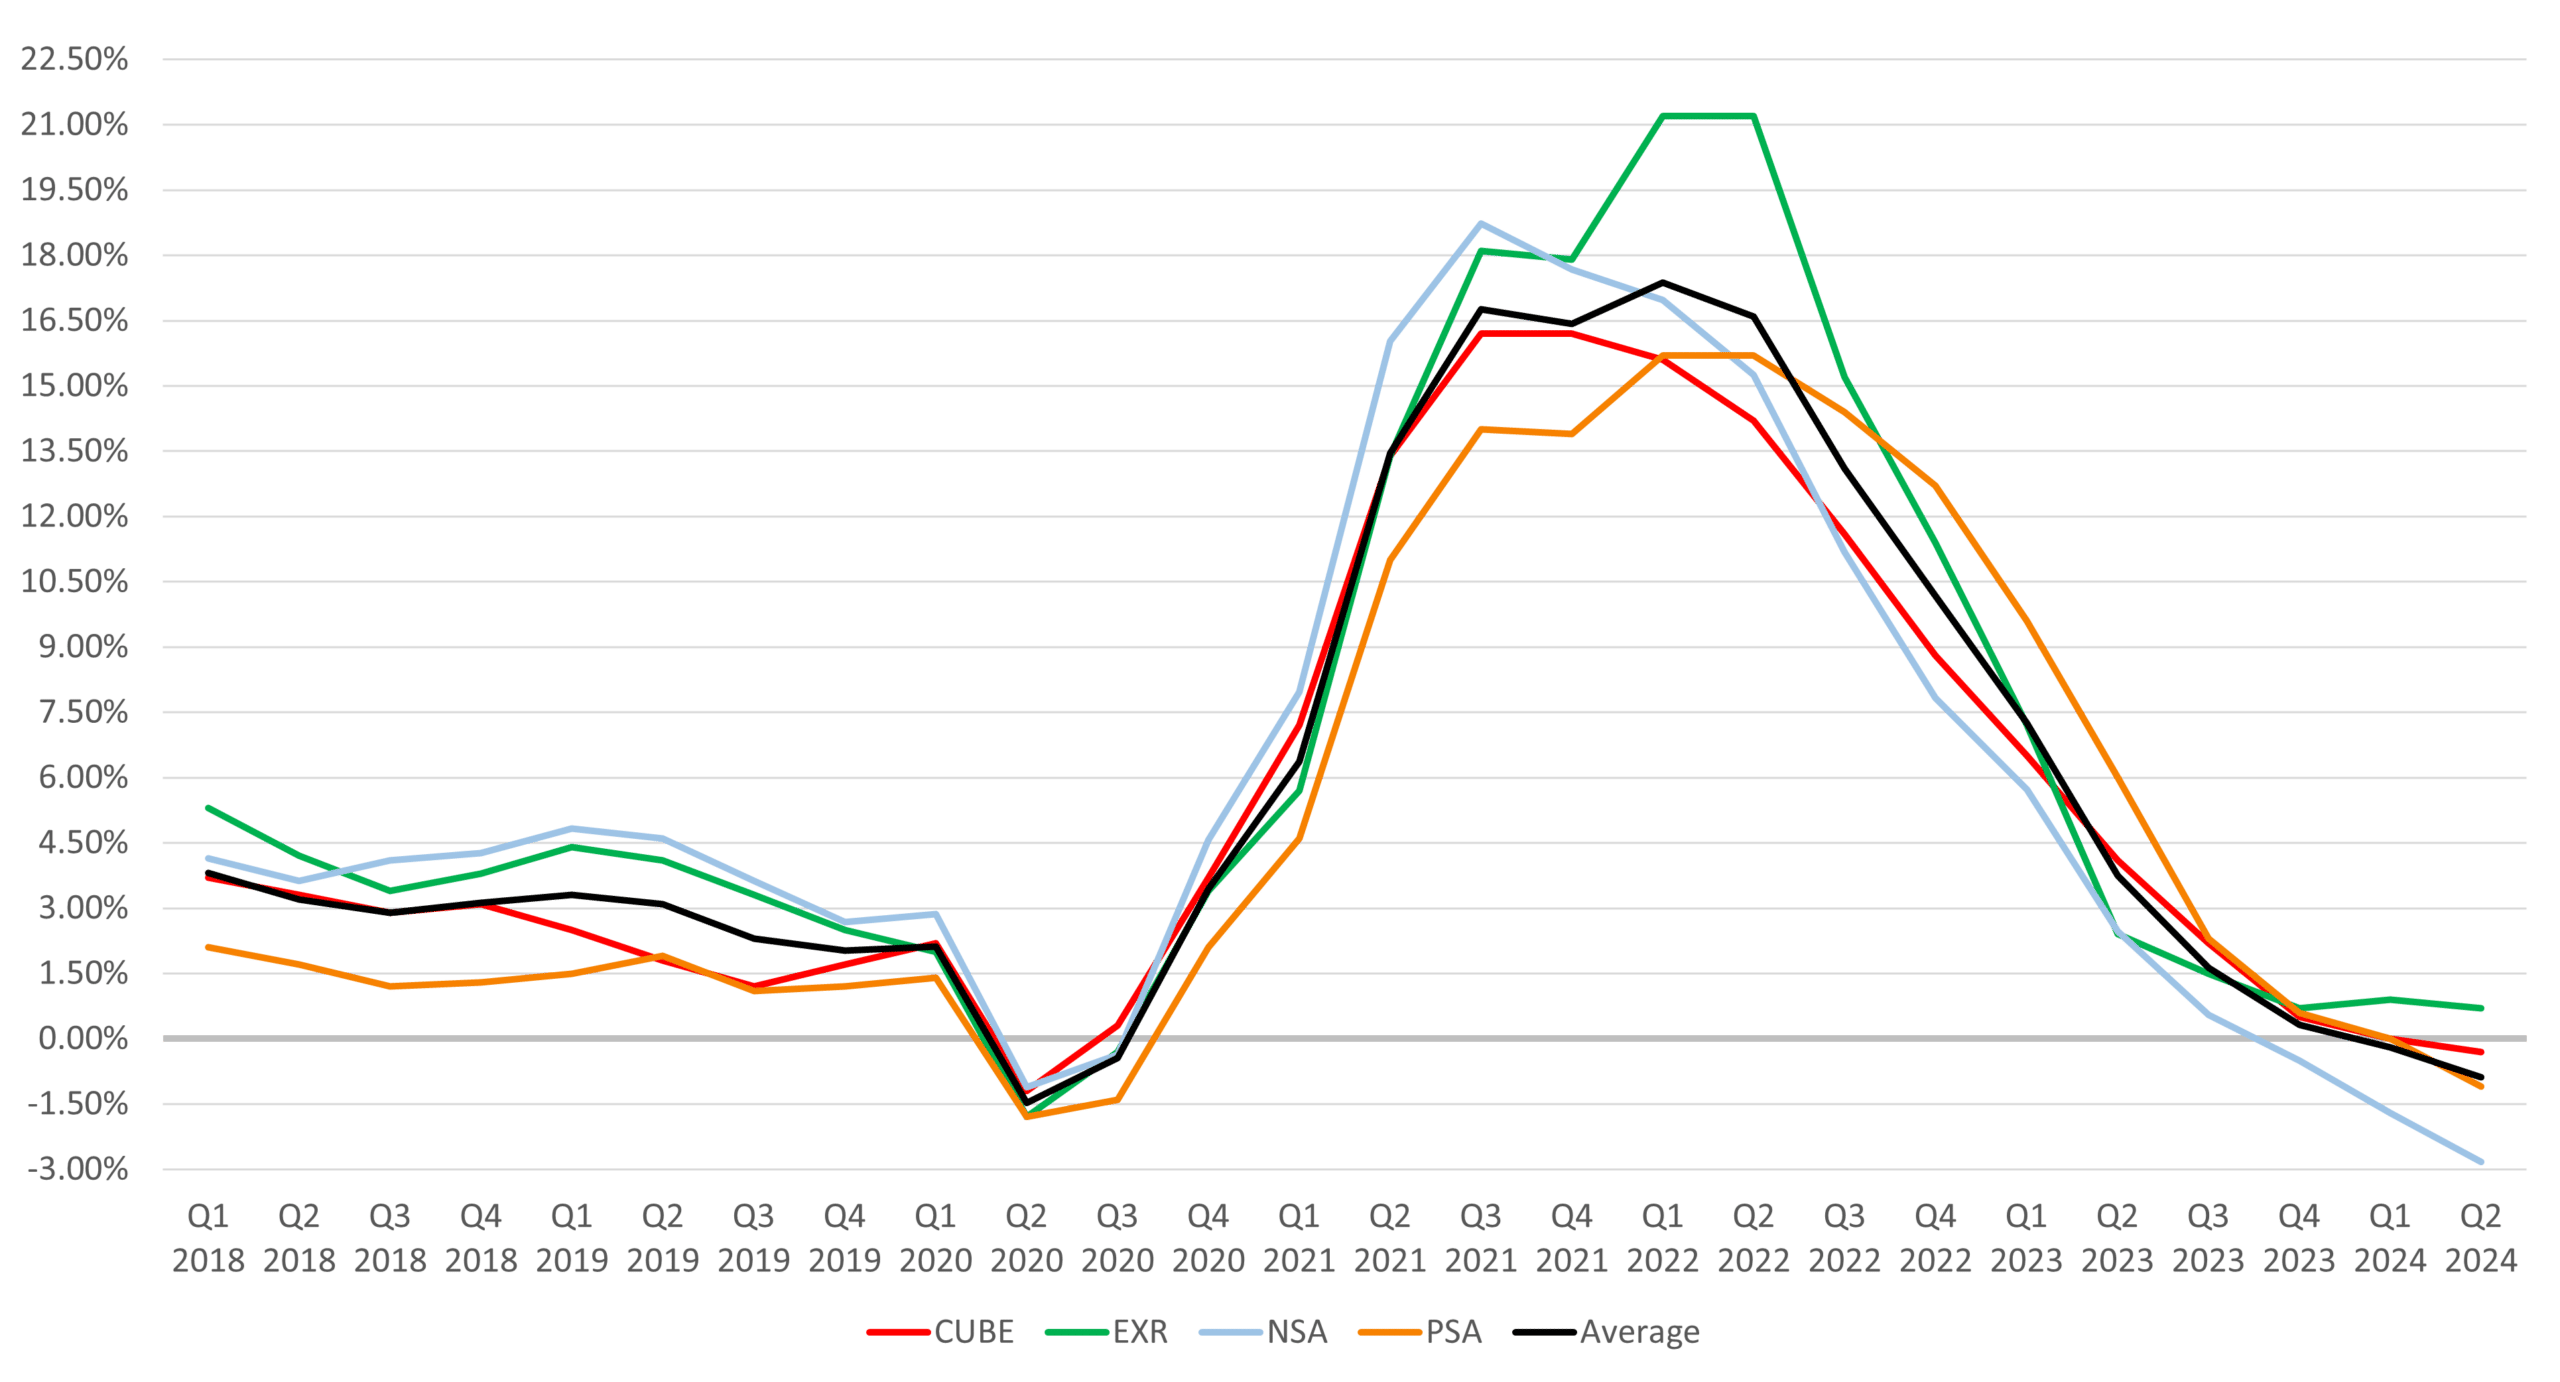
Achieved Rates (Same Store)
Self-Storage Occupancy
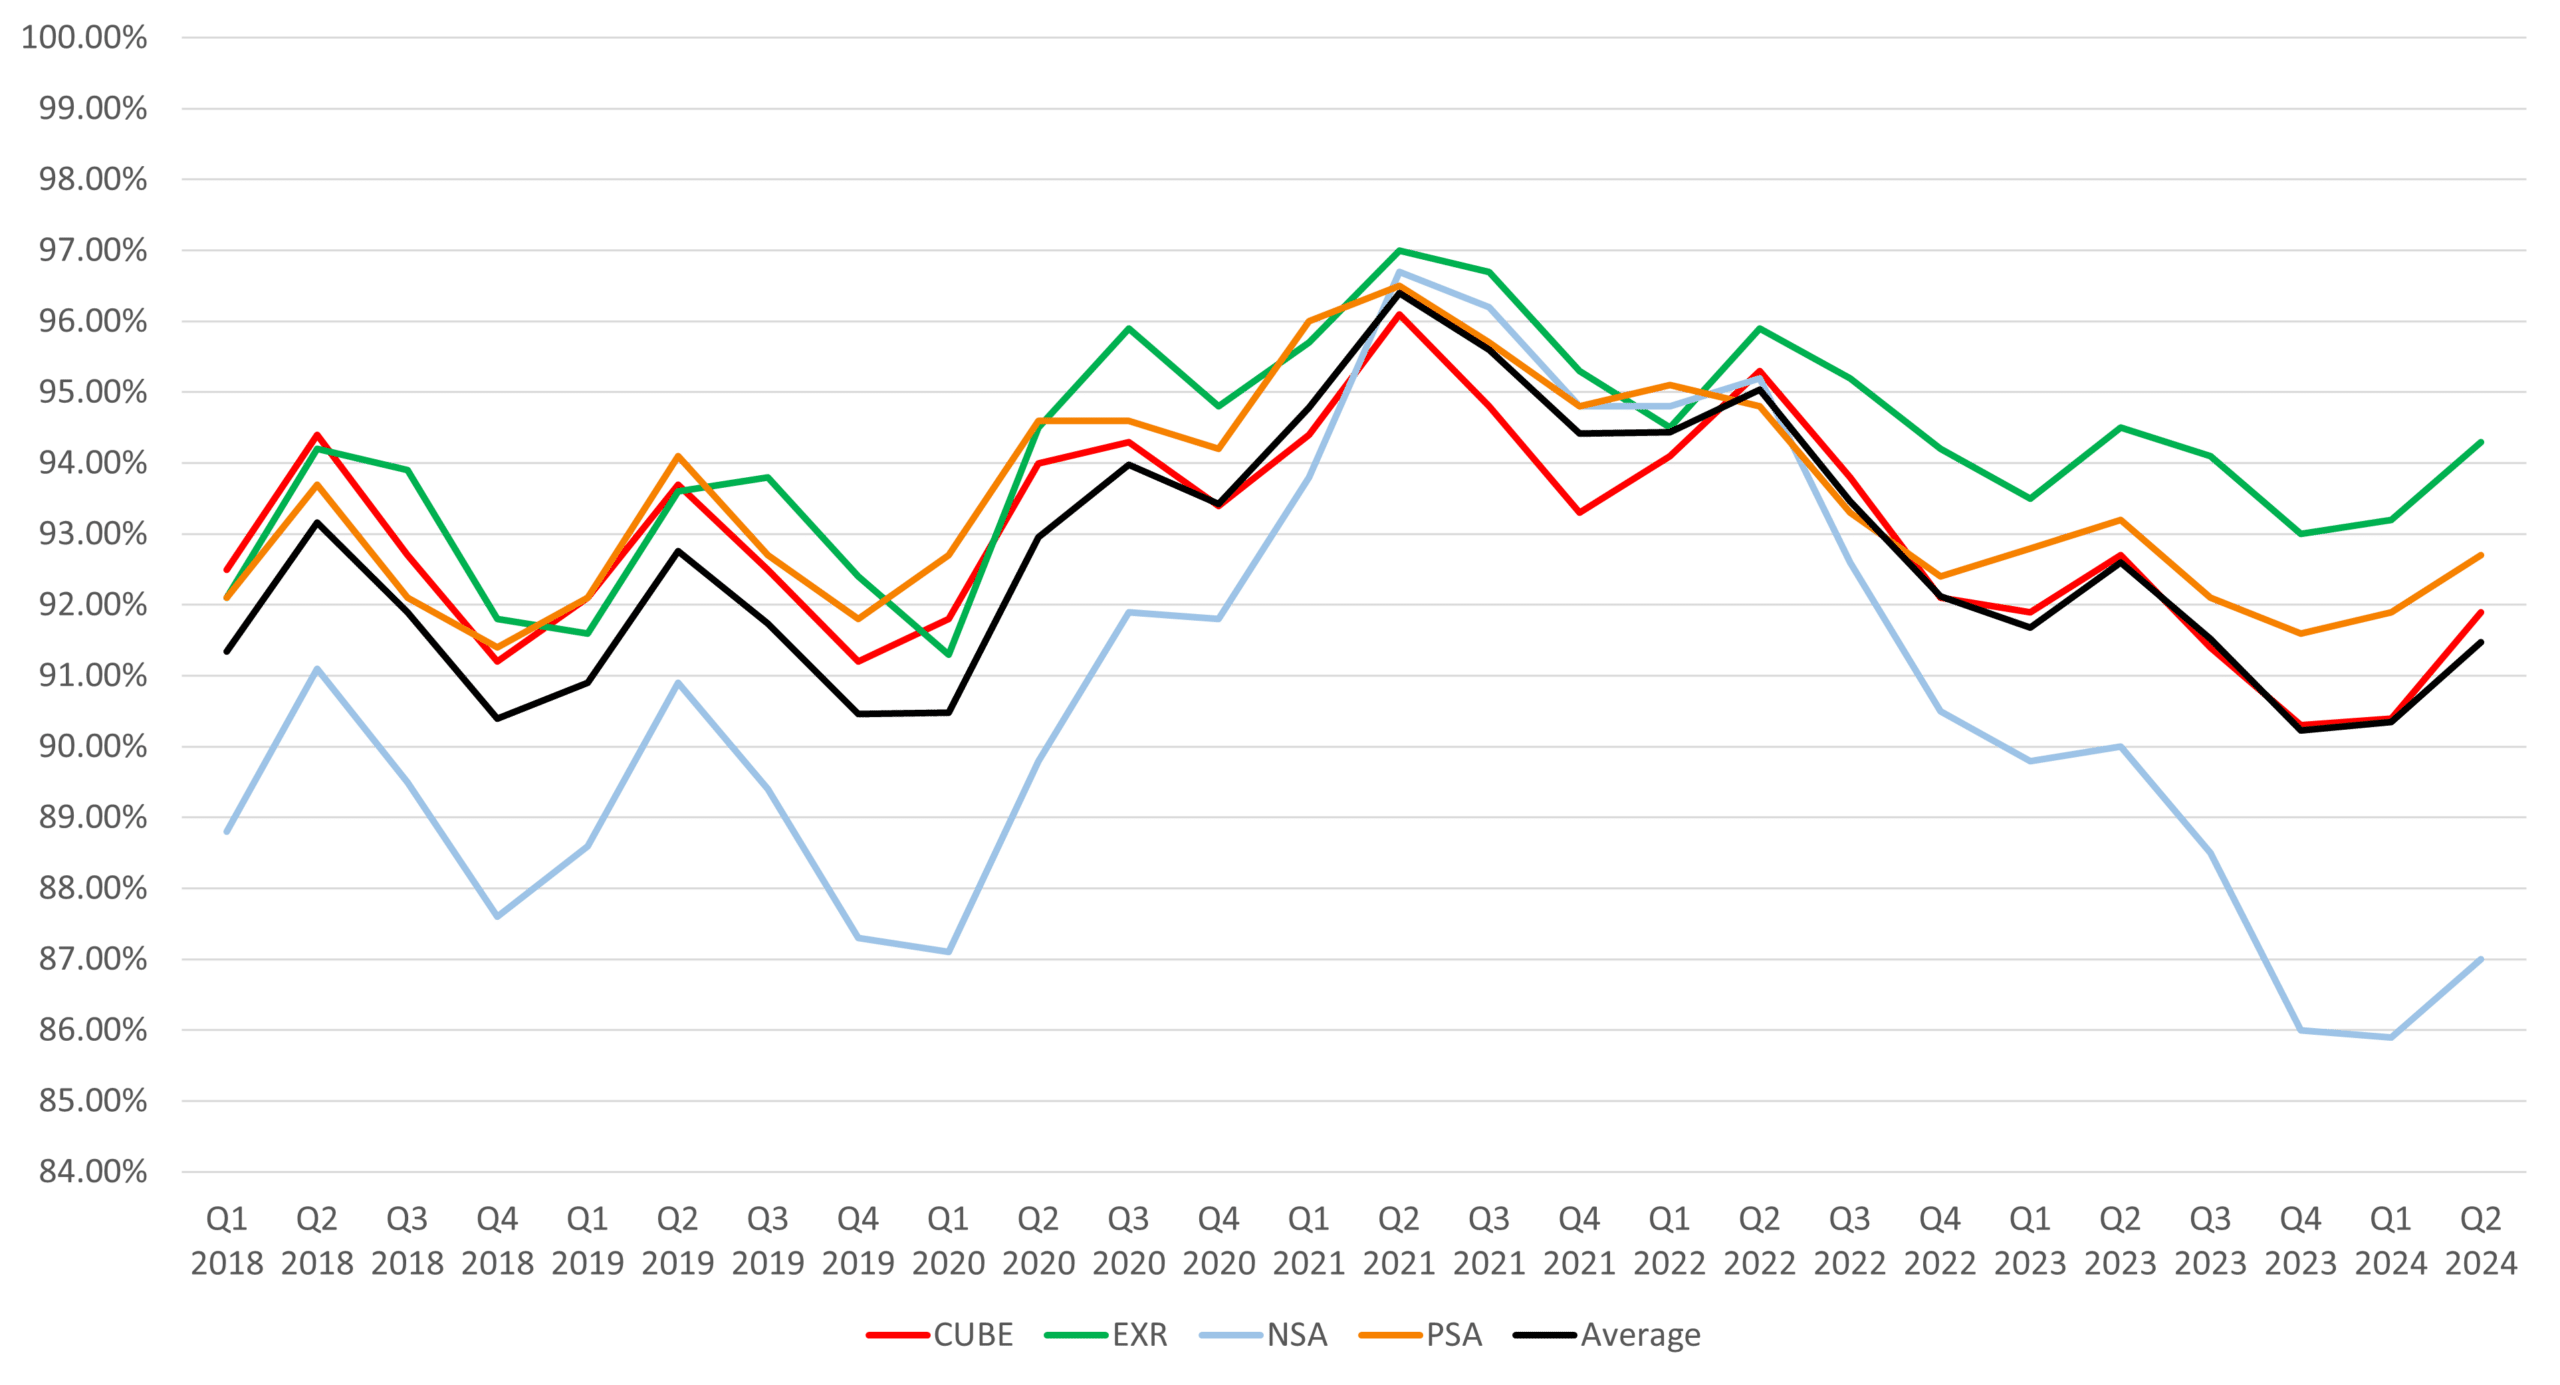
Occupancy rates showed resilience in some areas, with Public Storage reporting a positive net move-in trend for the year, narrowing its same store quarter ending occupancy gap by 50 basis points compared to 2023, and ending Q2 with a strong performance in their high-growth non-same-store pool, which reached 83% occupancy. Public also states that their in-place customers are behaving well with good payment patterns reduced vacate activity on a year-over-year basis and strong length of stays. Extra Space saw a 20 basis point YoY decline on its same store pool, finishing the quarter at 94.3%, while CubeSmart’s occupancy also decreased but by 70 basis points YoY, ending Q2 at 91.9% on its same store pool. NSA saw a 3% decline in occupancy on its same store facilities YoY, but noted that seasonal peaks have shifted earlier, with many REITs hitting their peak occupancy in late June rather than the traditional August.
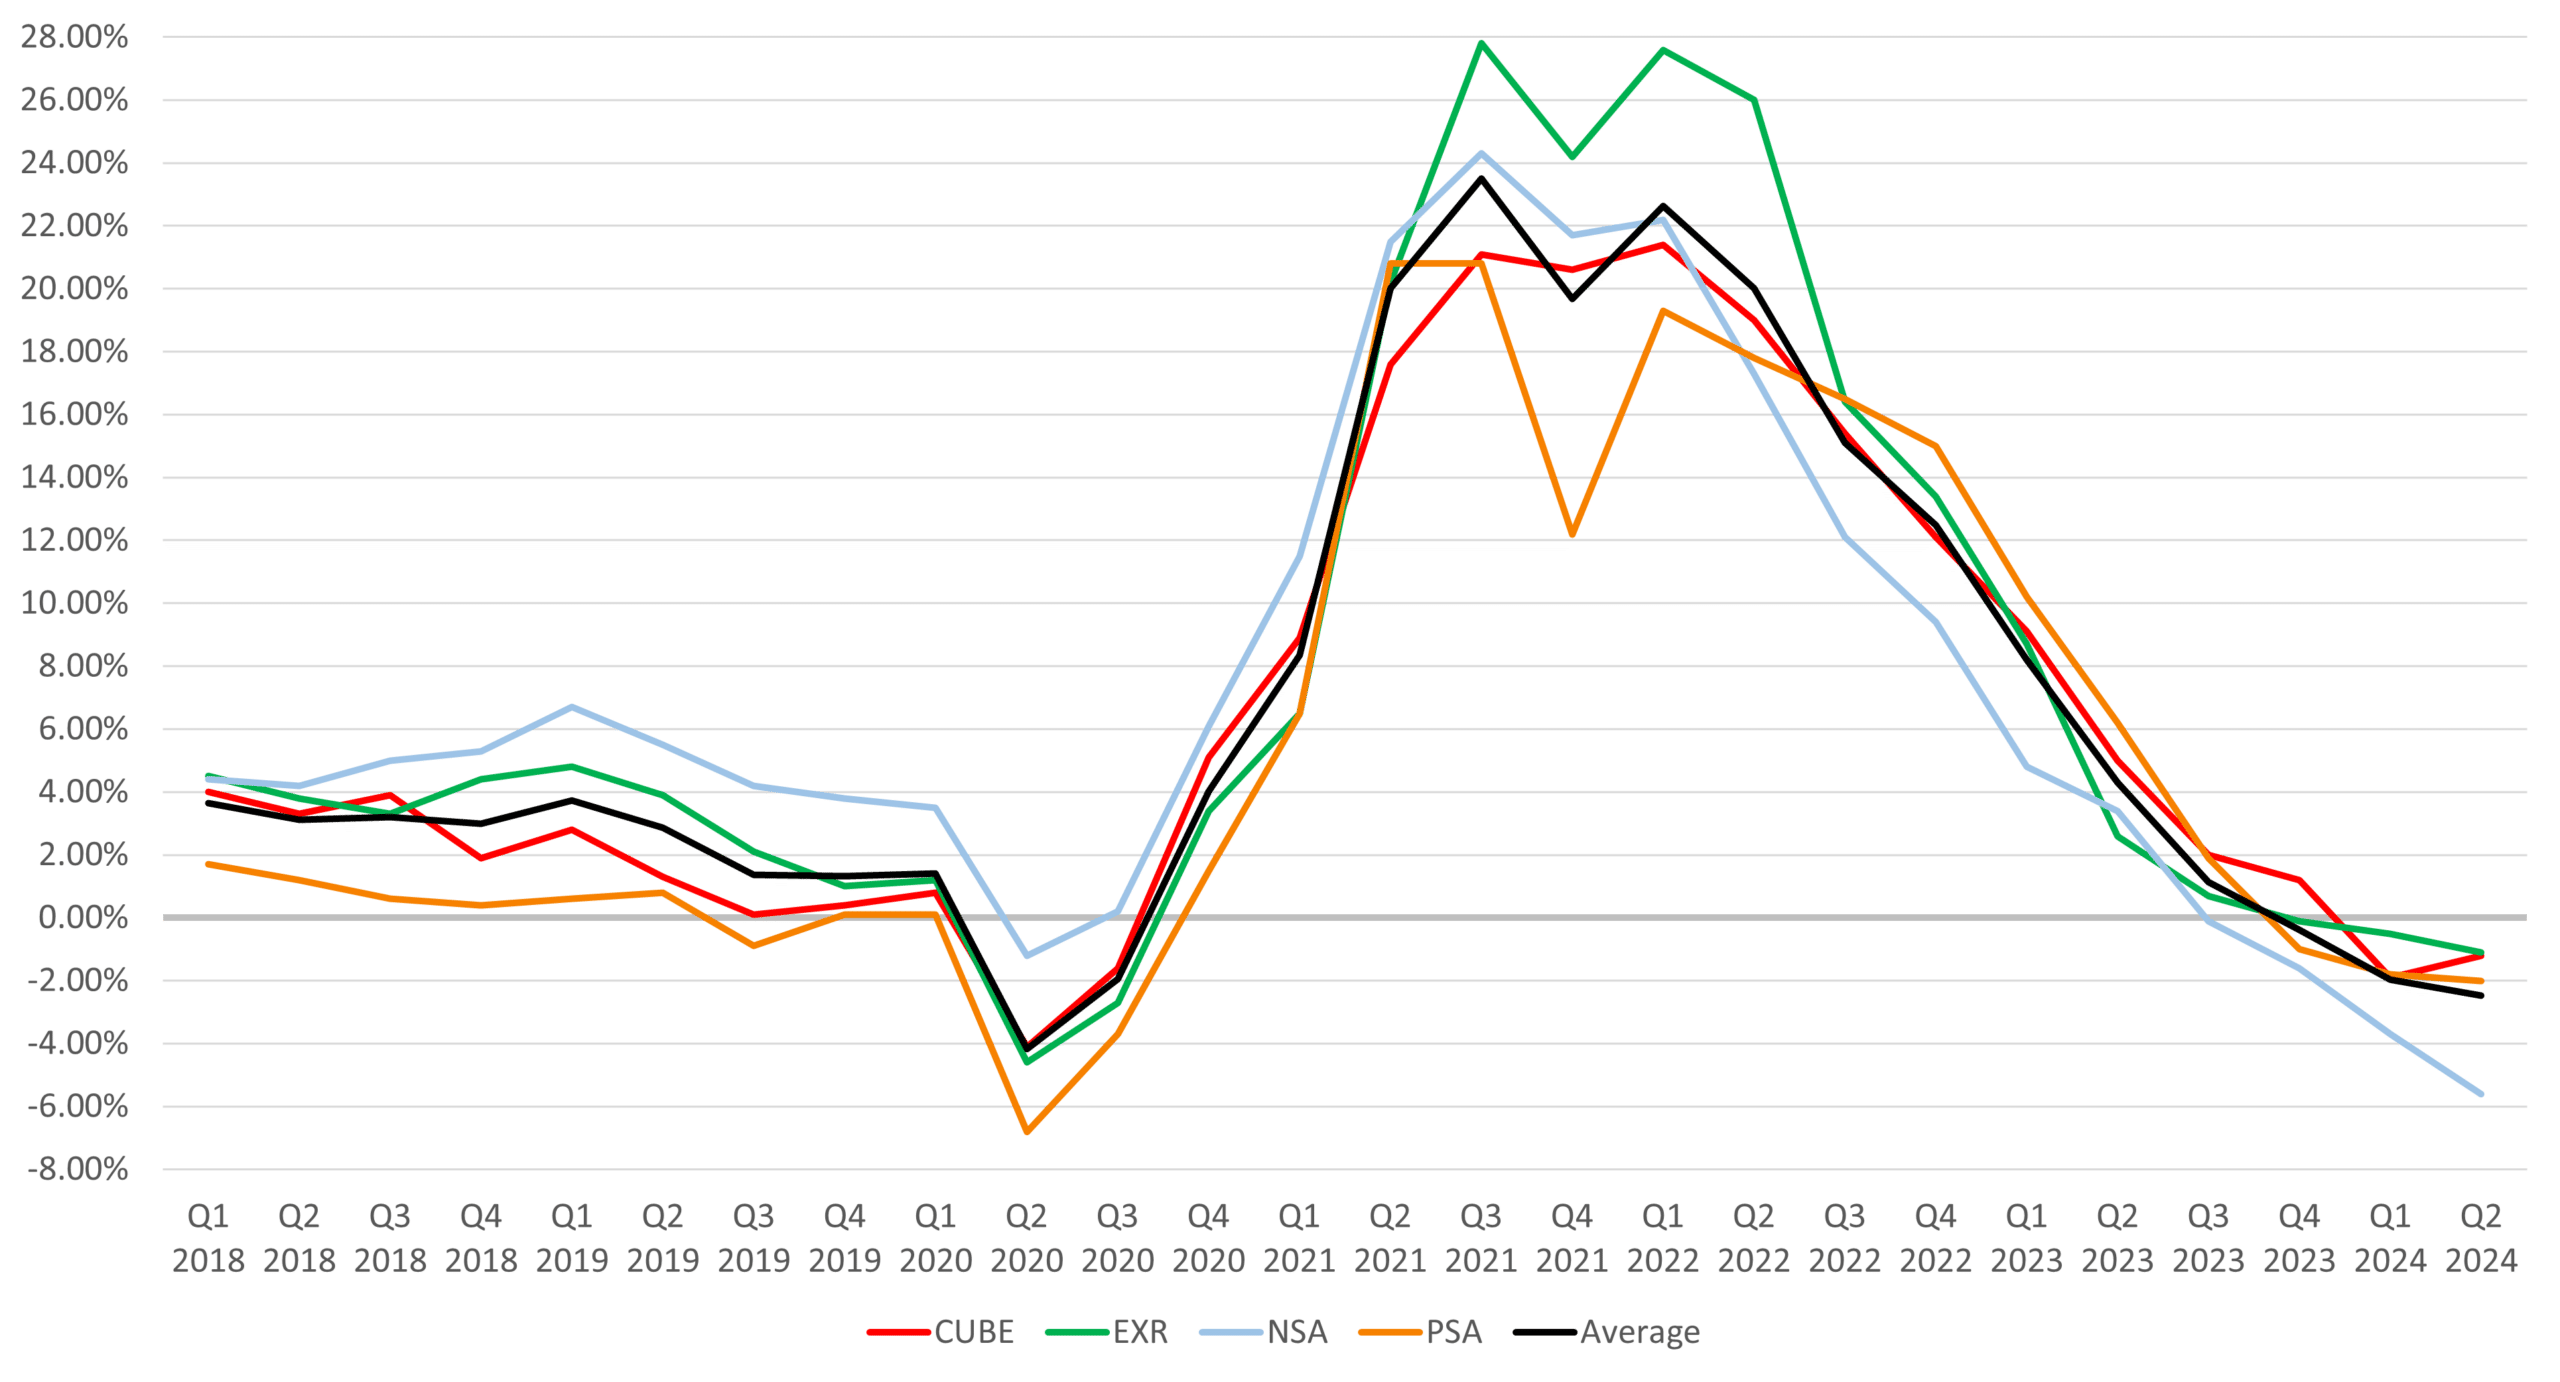
Period Ending Occupancy (Same Store)
Self-Storage Income & Expenses
Income growth was generally modest, with expenses rising more significantly across all REITs. Public Storage reported a 1.1% decline in same-store rental revenue and a 2% drop in NOI due to higher expenses, including a 90 basis point increase in operating costs. Despite these pressures, Public Storage maintained a strong operating margin at 79%. CubeSmart’s same-store rental revenue decreased by 0.3%, but saw a 4.2% increase in expenses, leading to a 1.2% decline in NOI. Extra Space experienced a 6% increase in same-store expenses, while NSA highlighted increased payroll and utility costs as key contributors to their rising expenses.
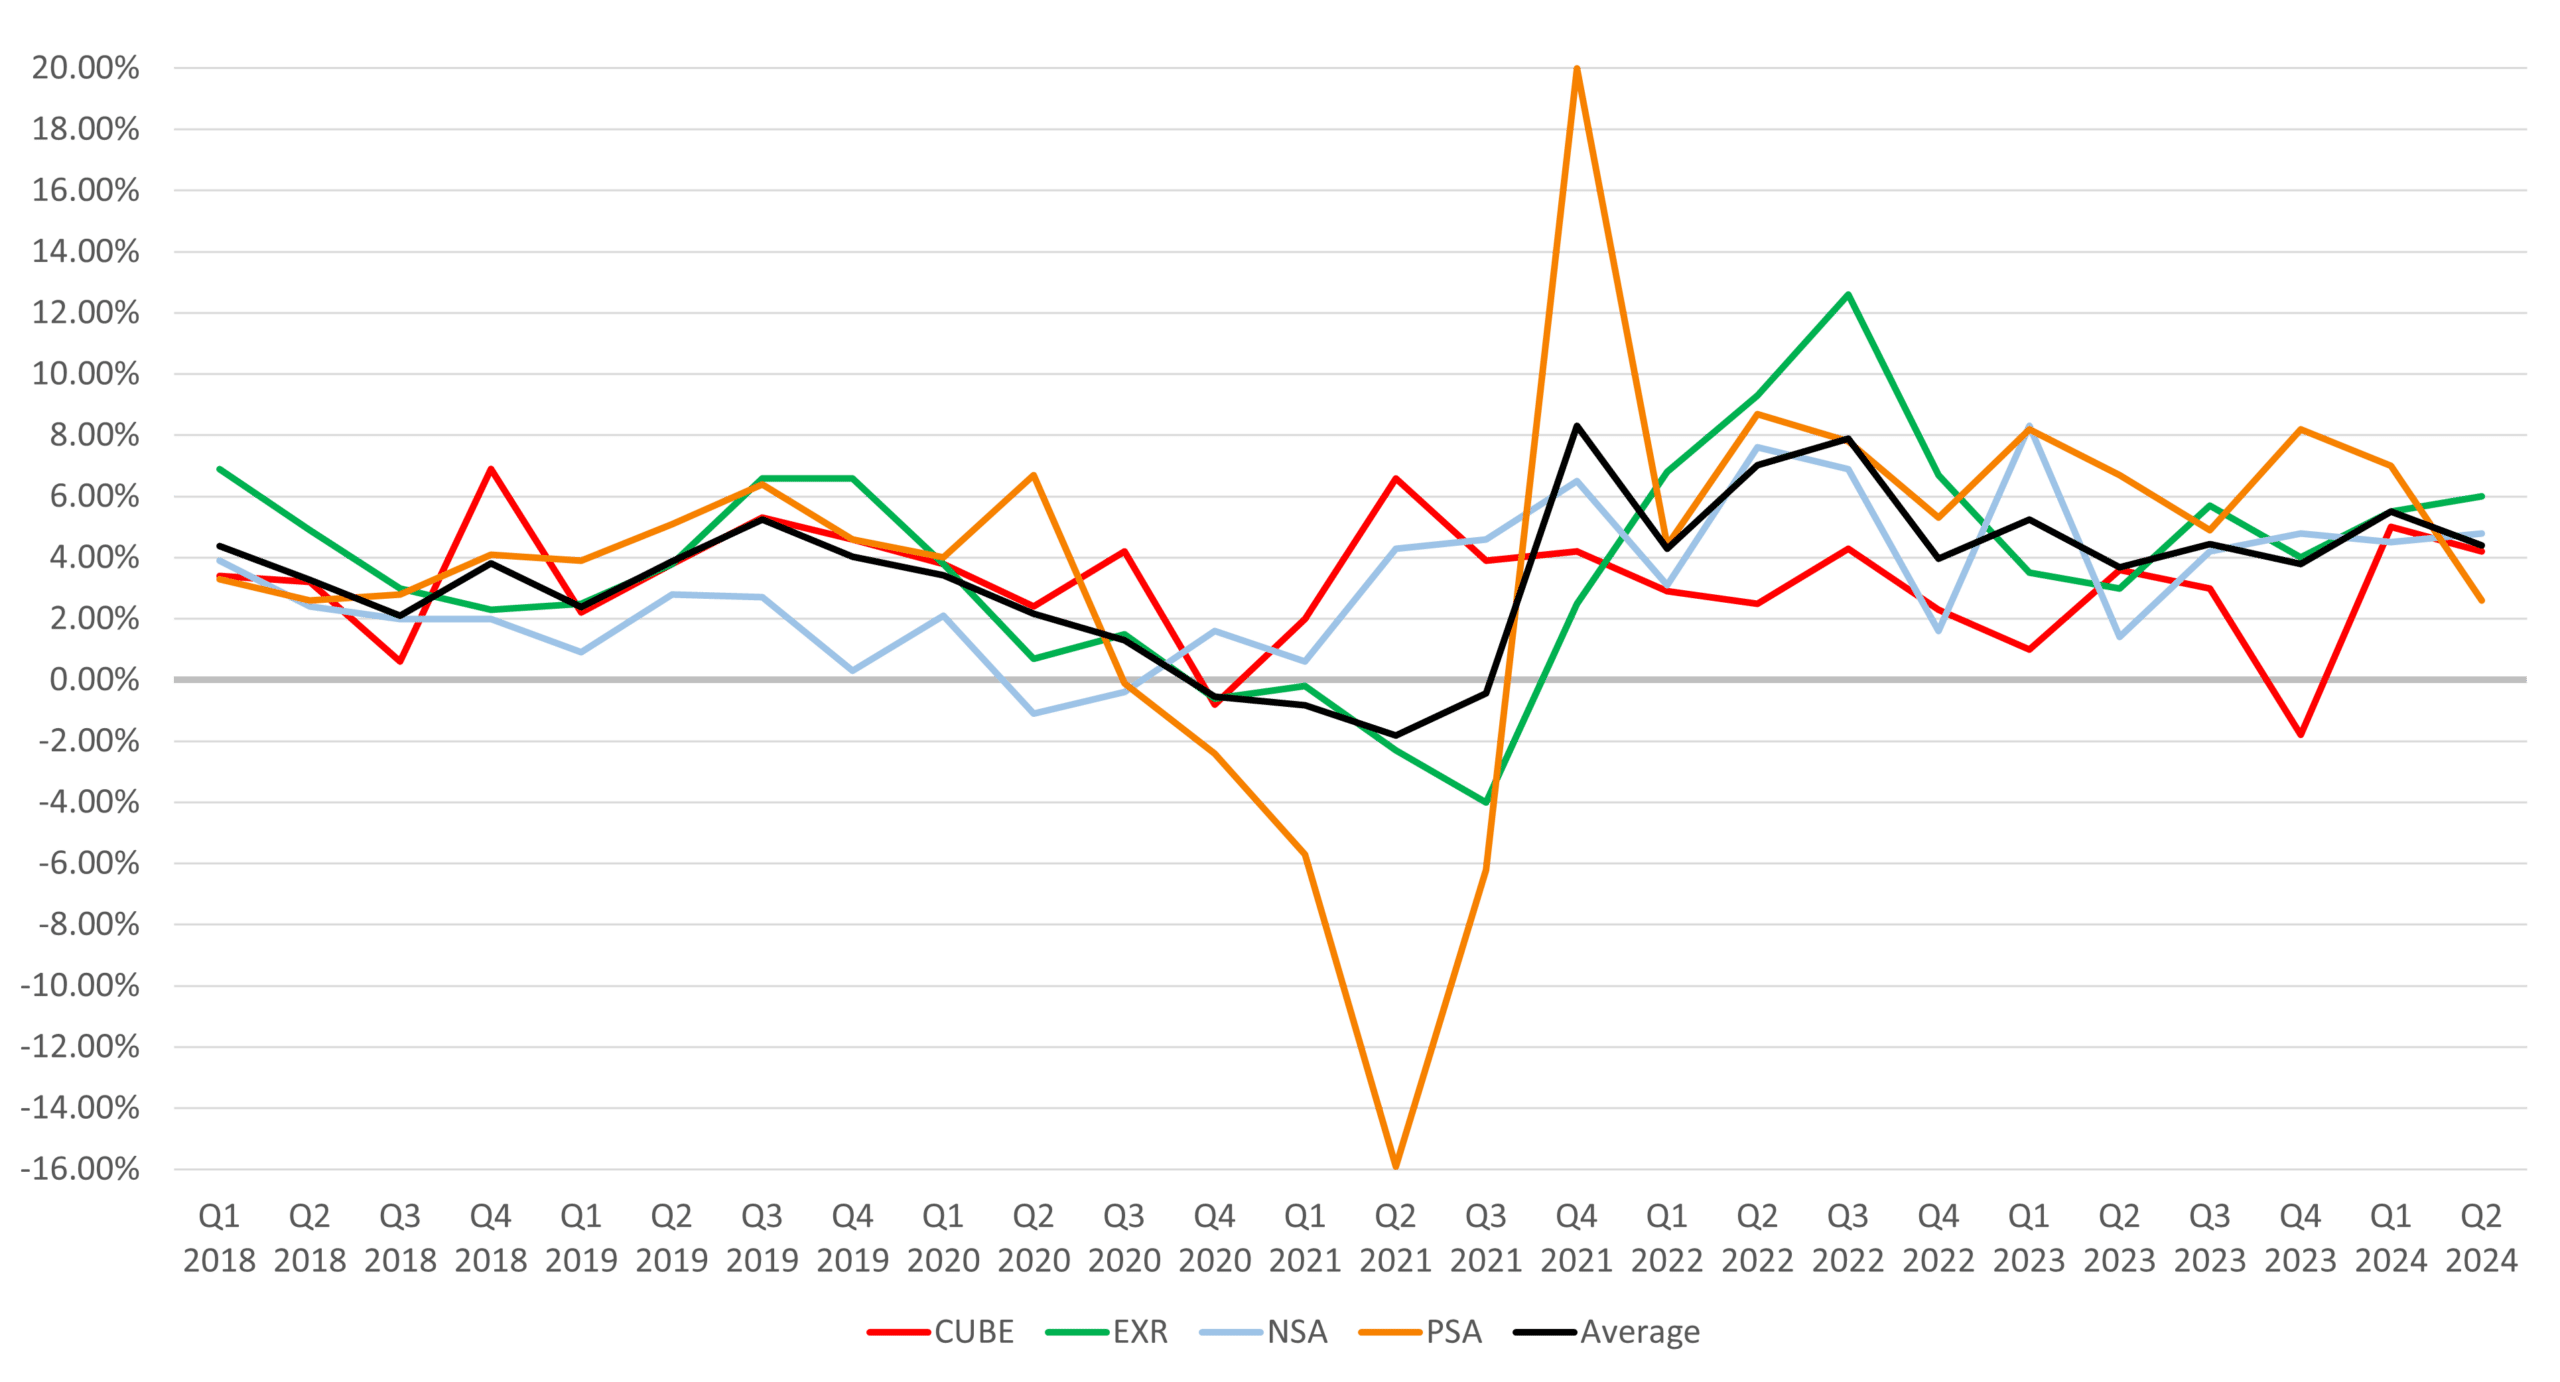
YoY Rental Income Growth (Same Store)
YoY Expense Growth (Same Store)
YoY NOI Growth (Same Store)
Self-Storage Investment & Transaction Activity
Investment activity remained cautious, with a focus on selective growth and capital preservation. Public Storage committed $450 million to new development projects, marking a record year for the company. CubeSmart opened two new projects in New York, totaling $61.8 million, and added 39 stores to its third-party management platform, bringing the total to 879 stores under management. Extra Space expanded its bridge loan program with $433 million in new loans, reflecting a strategic shift amid a quiet acquisition market. NSA also focused on internal growth and redevelopment, with fewer external acquisitions due to the wide bid-ask spread.
Acquisition Dollar Amount History
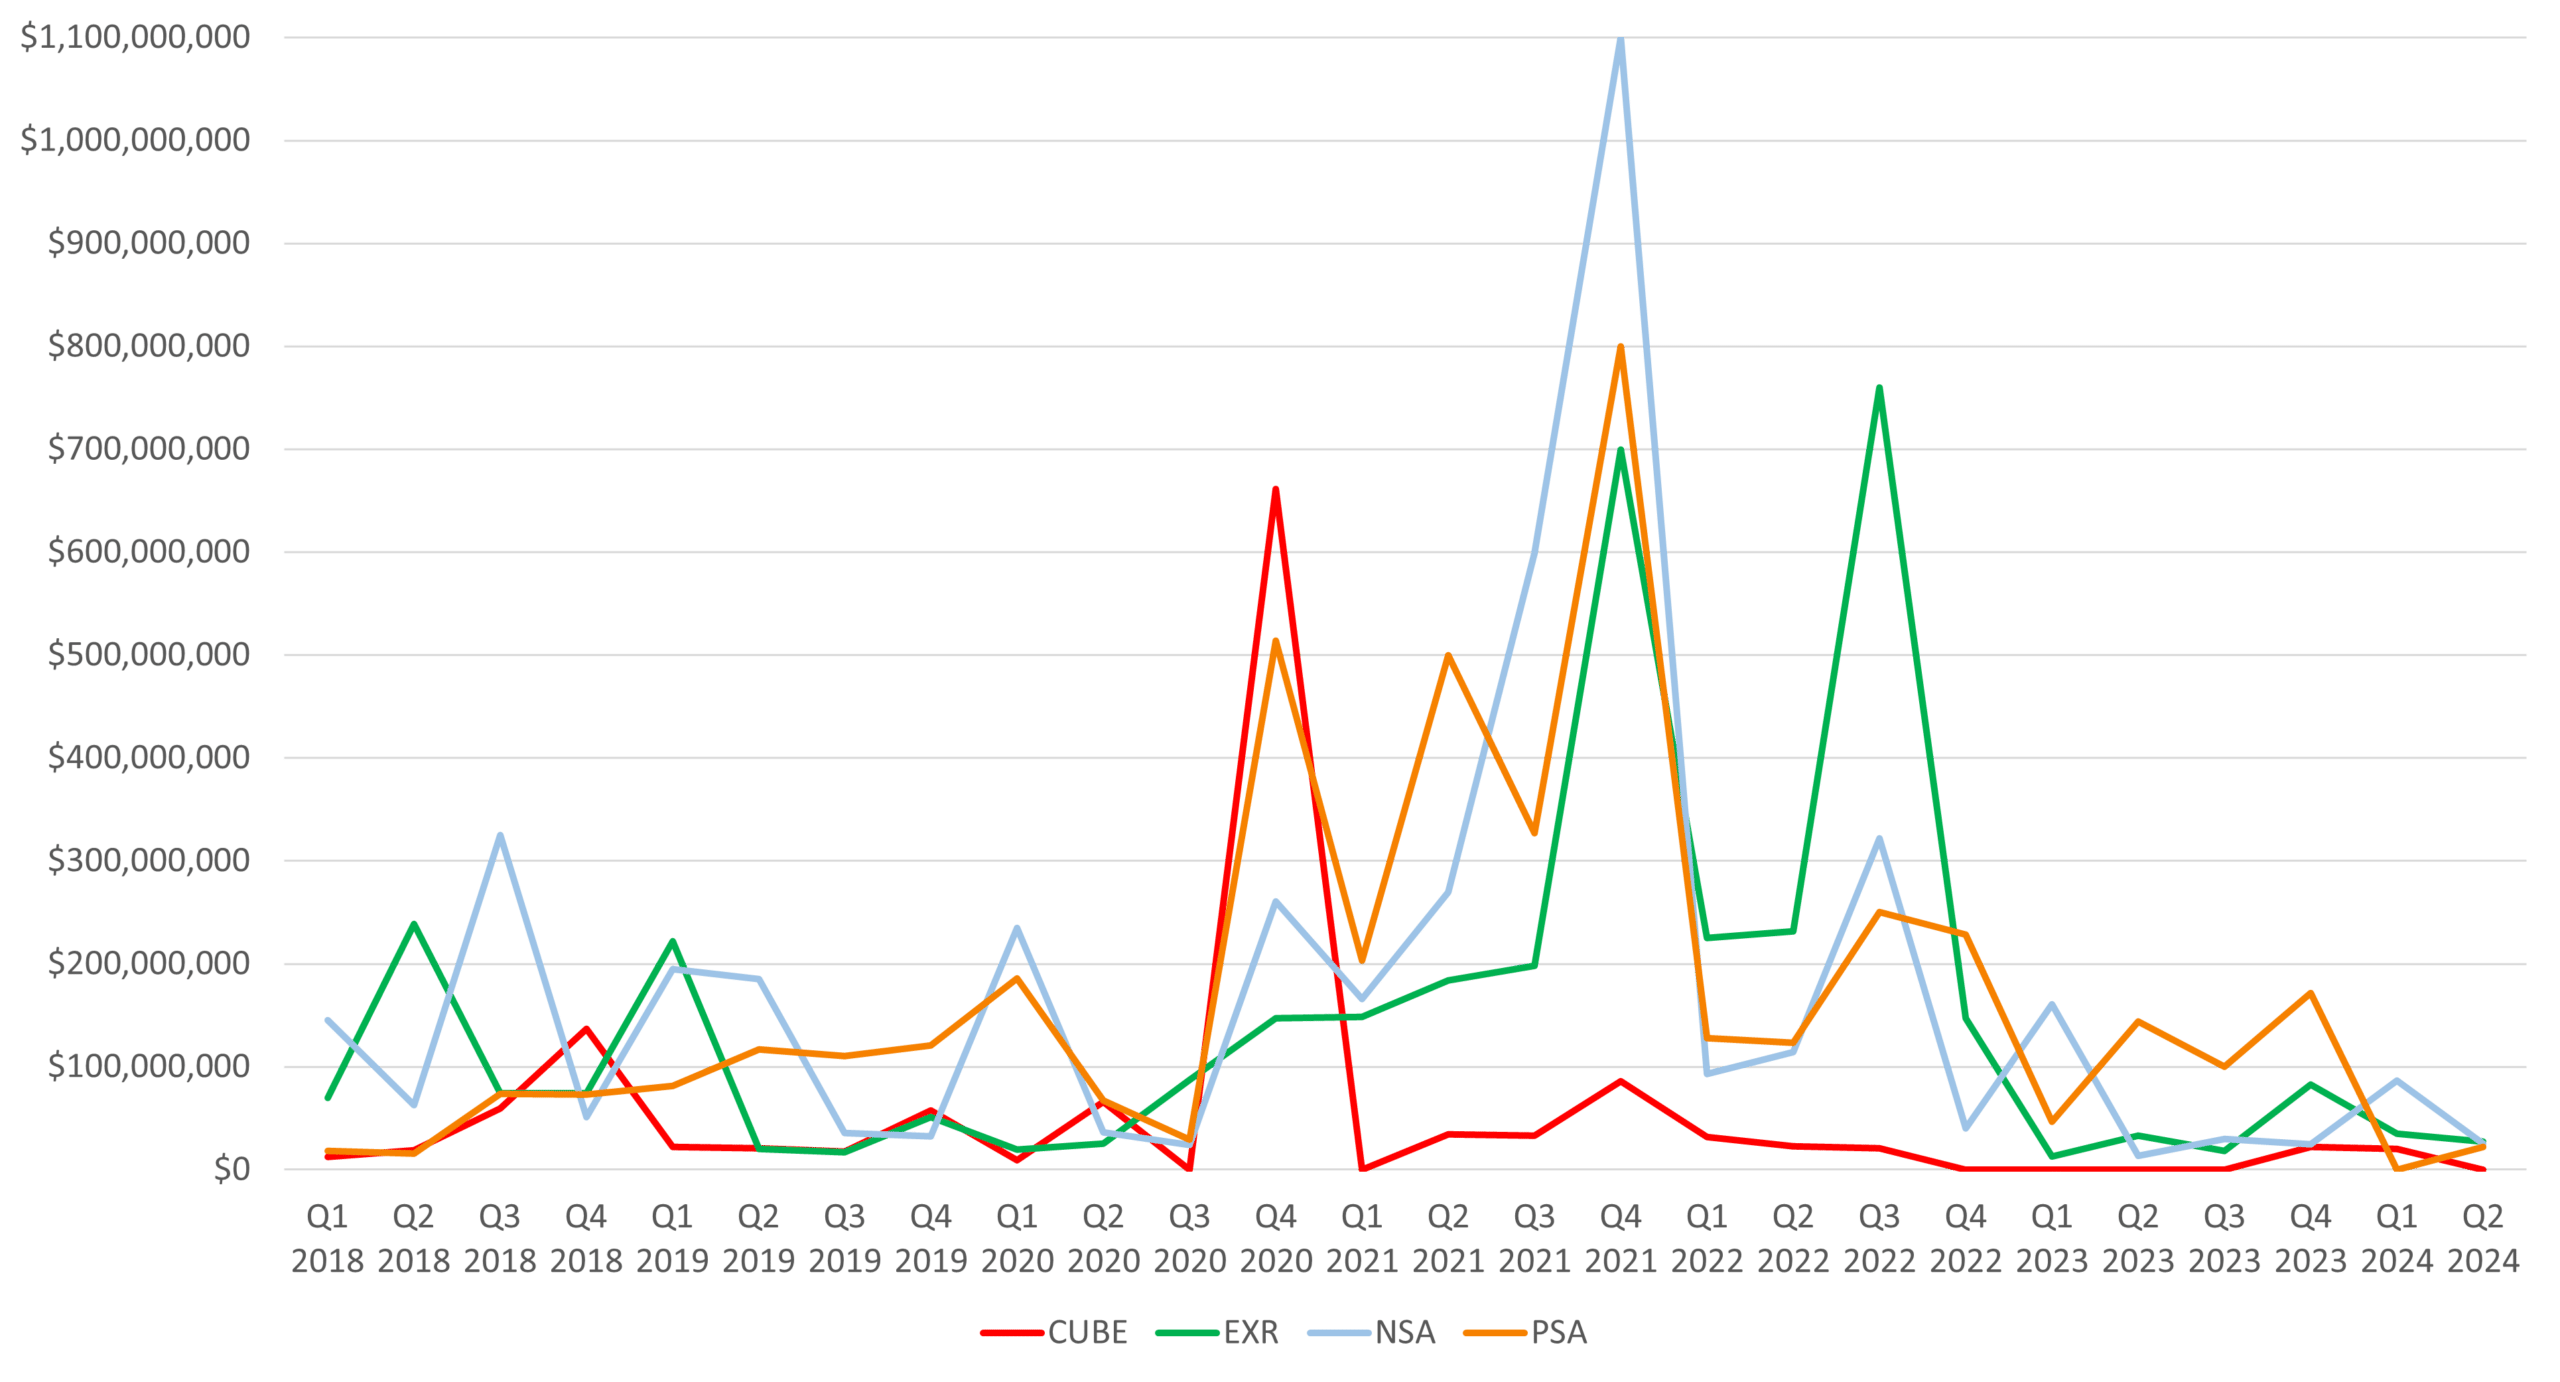
*Excludes PSA Acquisition of ezStorage in Q2 2021 for $1.8 Billion
*Excludes PSA Acquisition of All Storage in Q4 2021 for $1.5 Billion
*Excludes PSA Acquisition of Simply Storage in Q3 2023 for $2.2 Billion
*Excludes EXR Acquisition of Life Storage in Q3 2023 for $11.6 Billion
Self-Storage Monthly Transactions 2018-2024
* Source: CoStar
Under Construction NRSF as a % of Existing Inventory
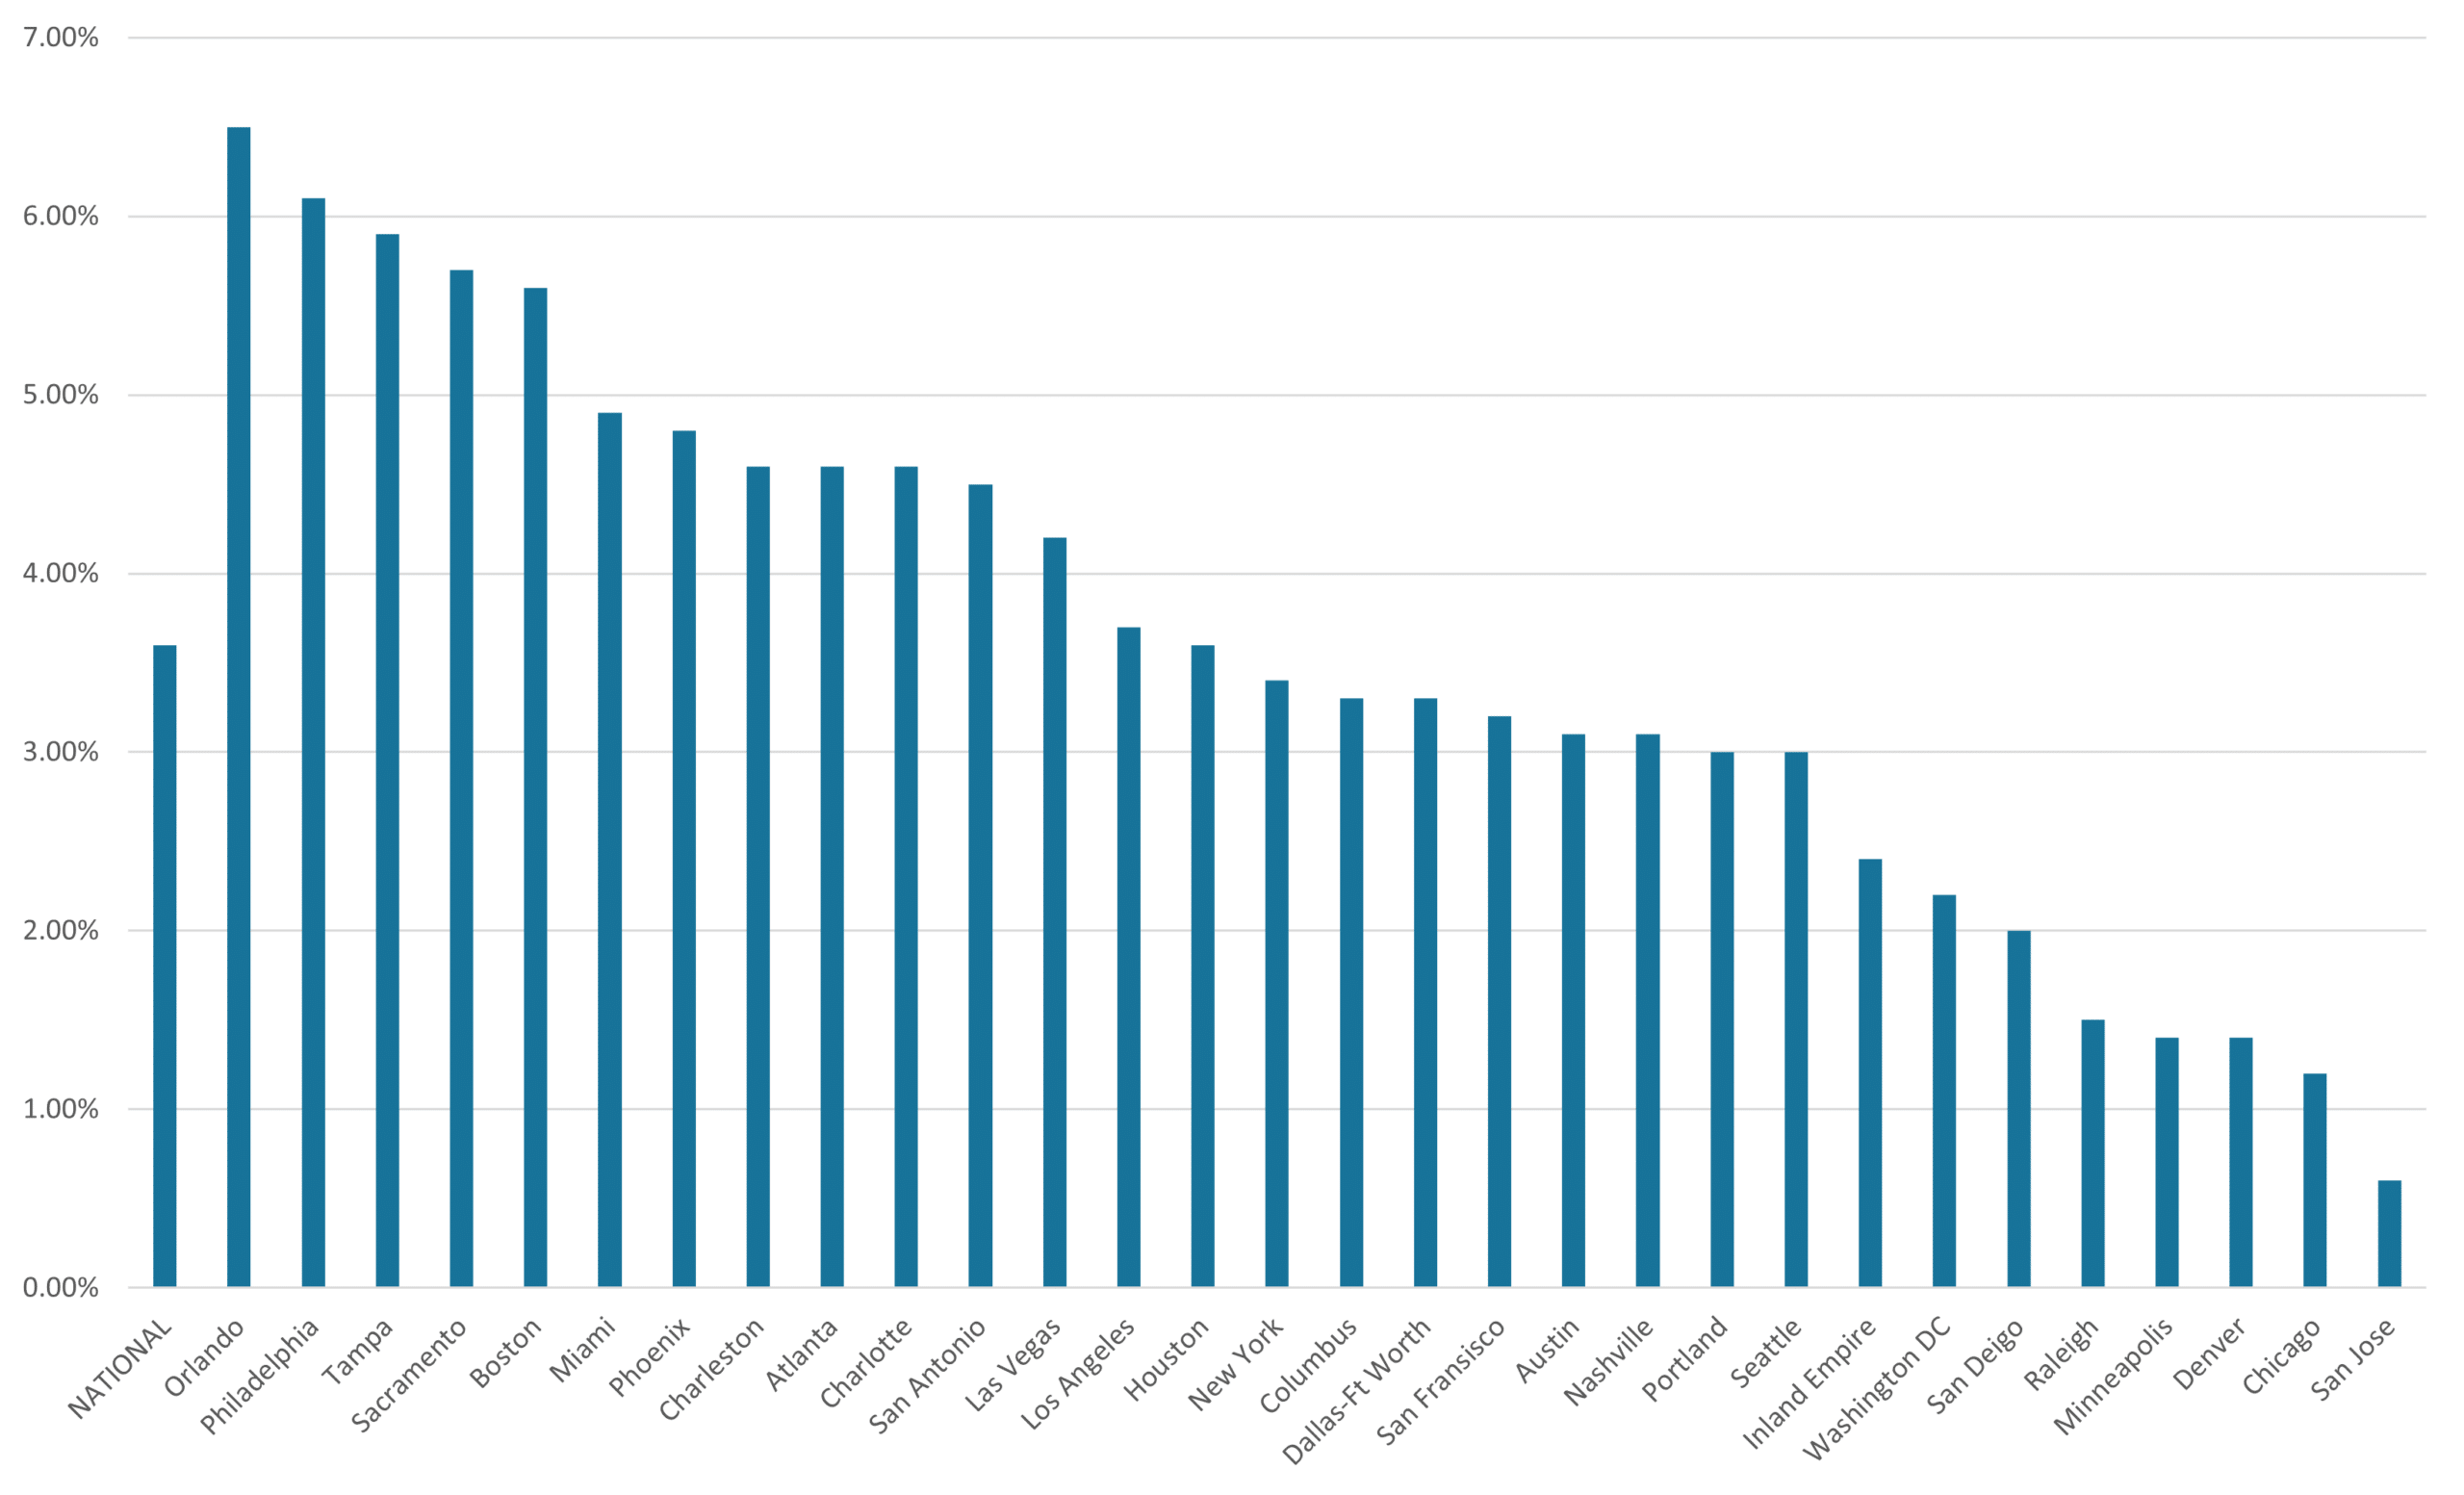
* Source: Yardi Matrix
NRSF Delivered as a % of Starting Inventory
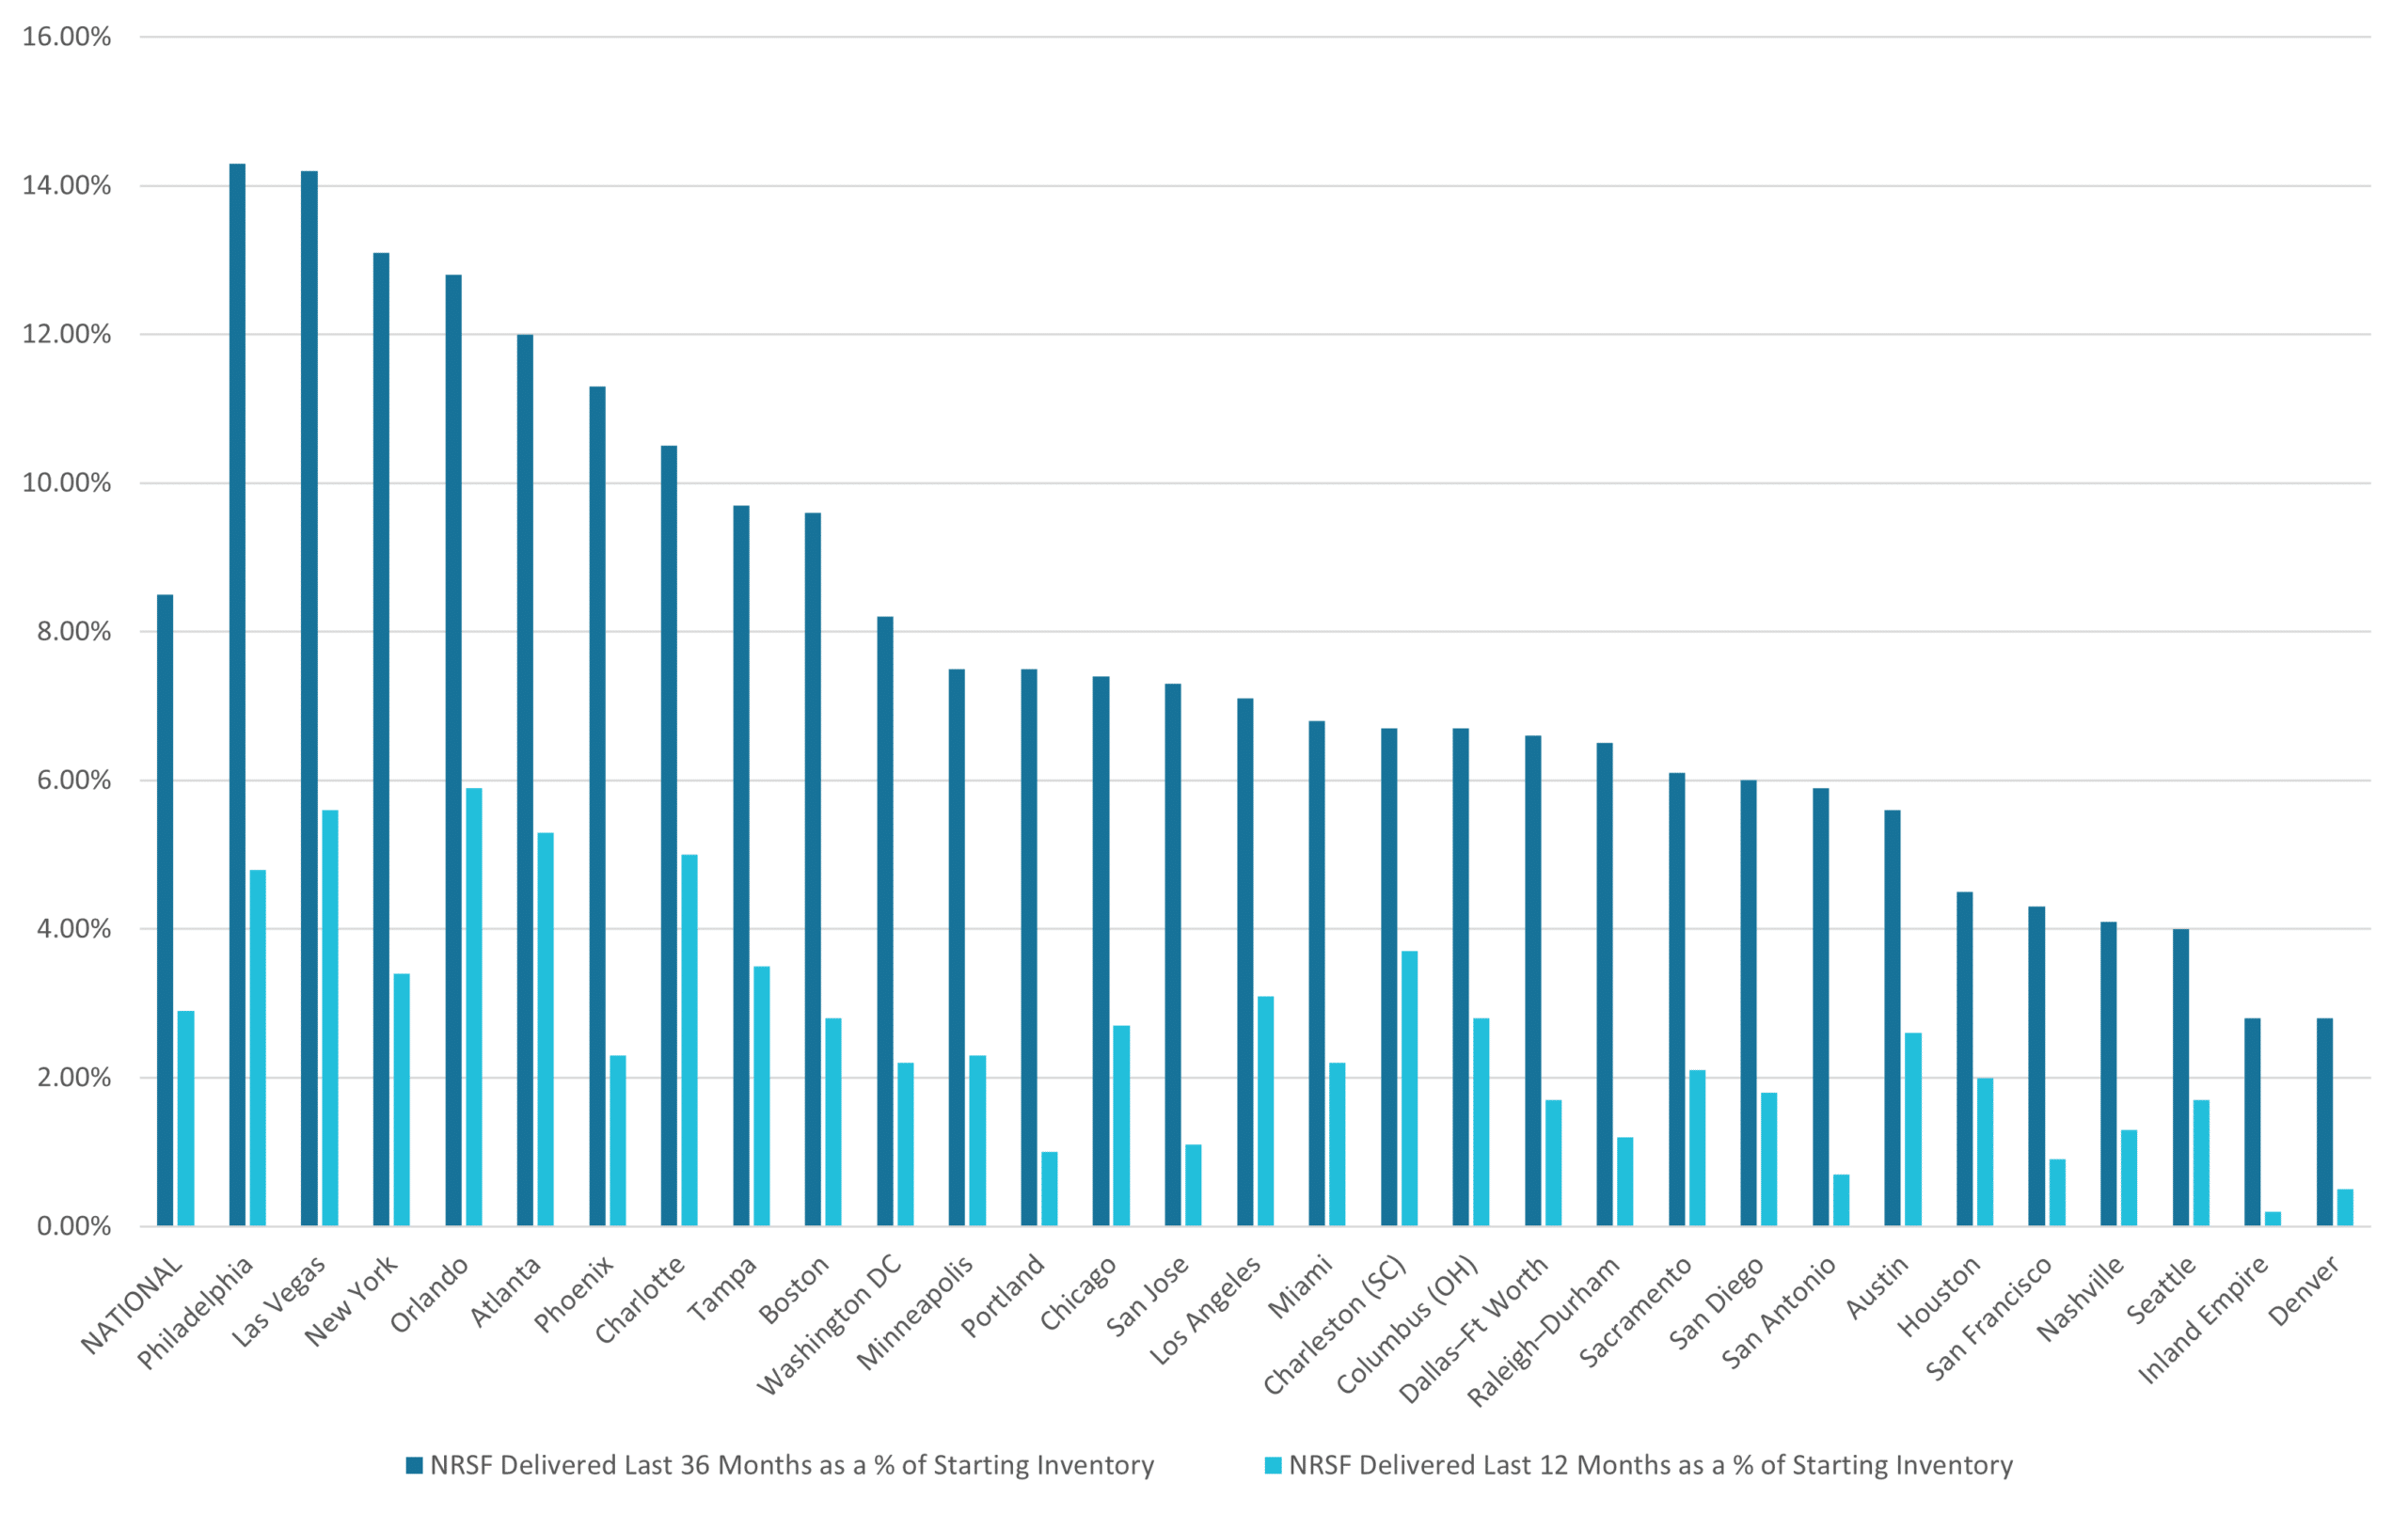
* Source: Yardi Matrix
Self-Storage Cap Rates & Bid-Ask Spread
The cap rates across the sector have remained stable, but the bid-ask spread continues to challenge transaction activity. Public Storage noted some narrowing of this spread, but transactions have been limited. CubeSmart and Extra Space also observed a wide spread, with sellers and buyers finding it difficult to agree on pricing. NSA highlighted that the spread has narrowed somewhat, but acquisition activity remains subdued, with the market waiting for more favorable conditions.
Implied Cap Rate History
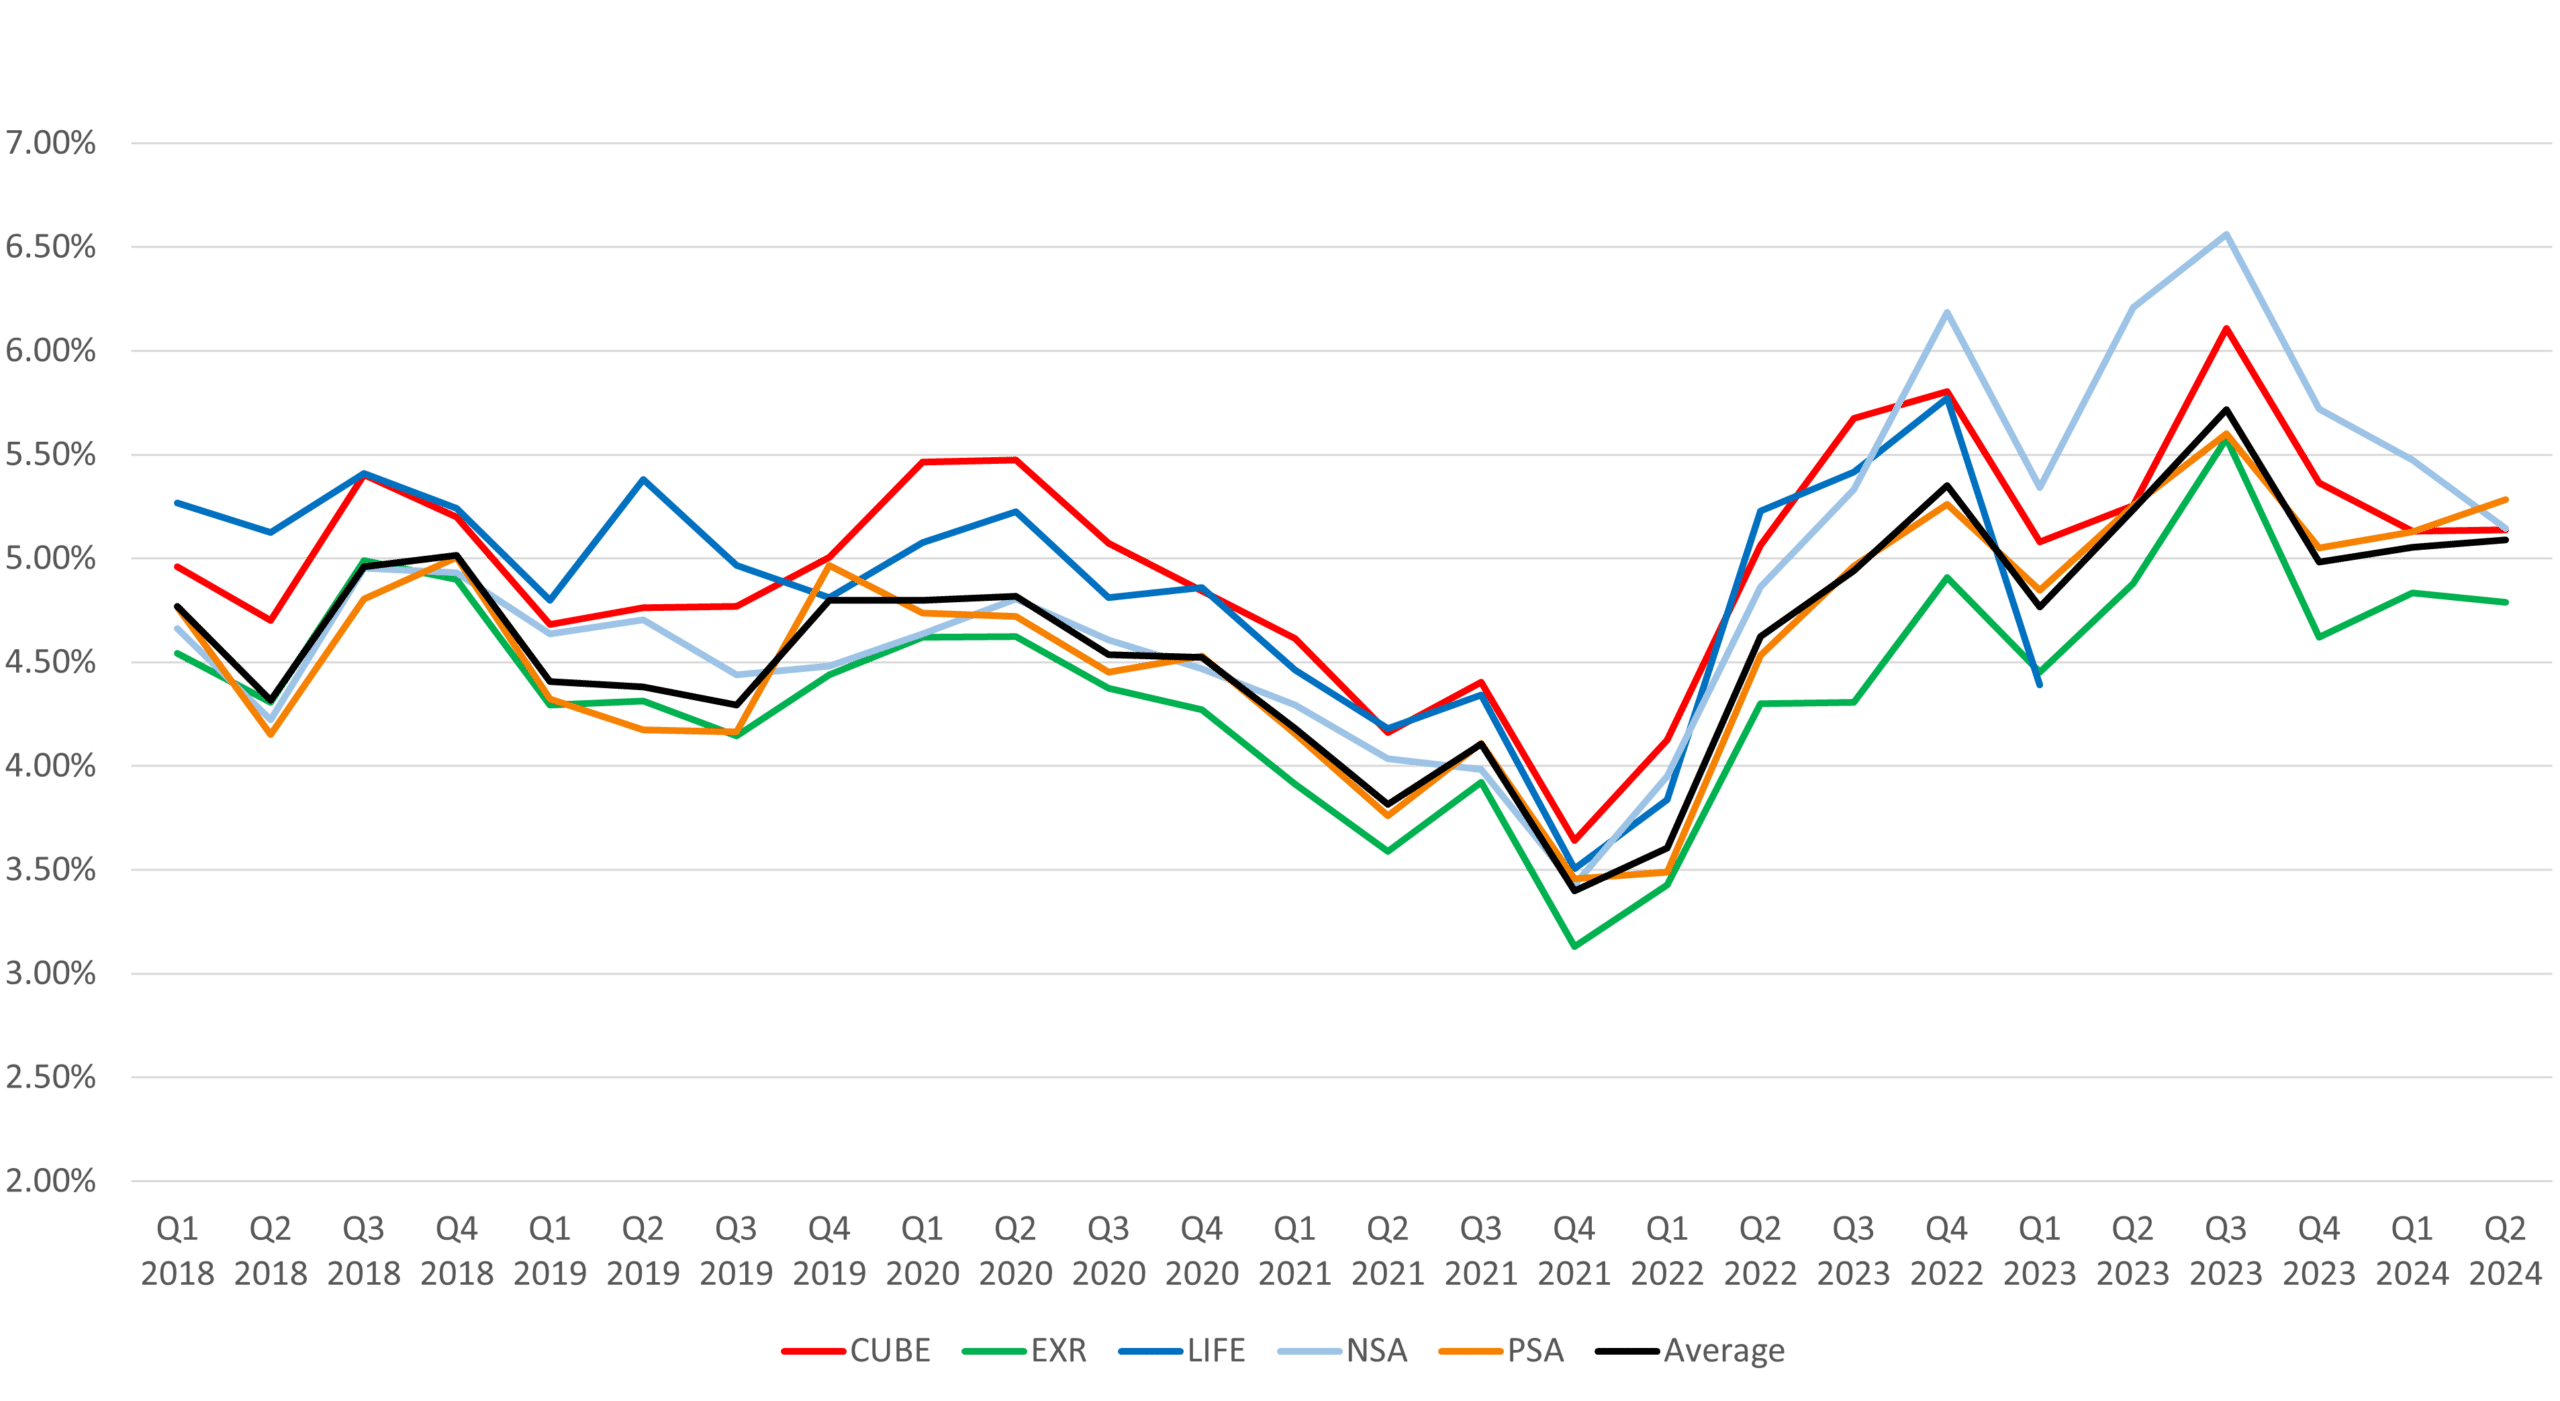
*The implied cap rate data indicates the market value of each REIT.
The implied capitalization rate is a culmination of the company value and total debt of each company divided by its NOI.
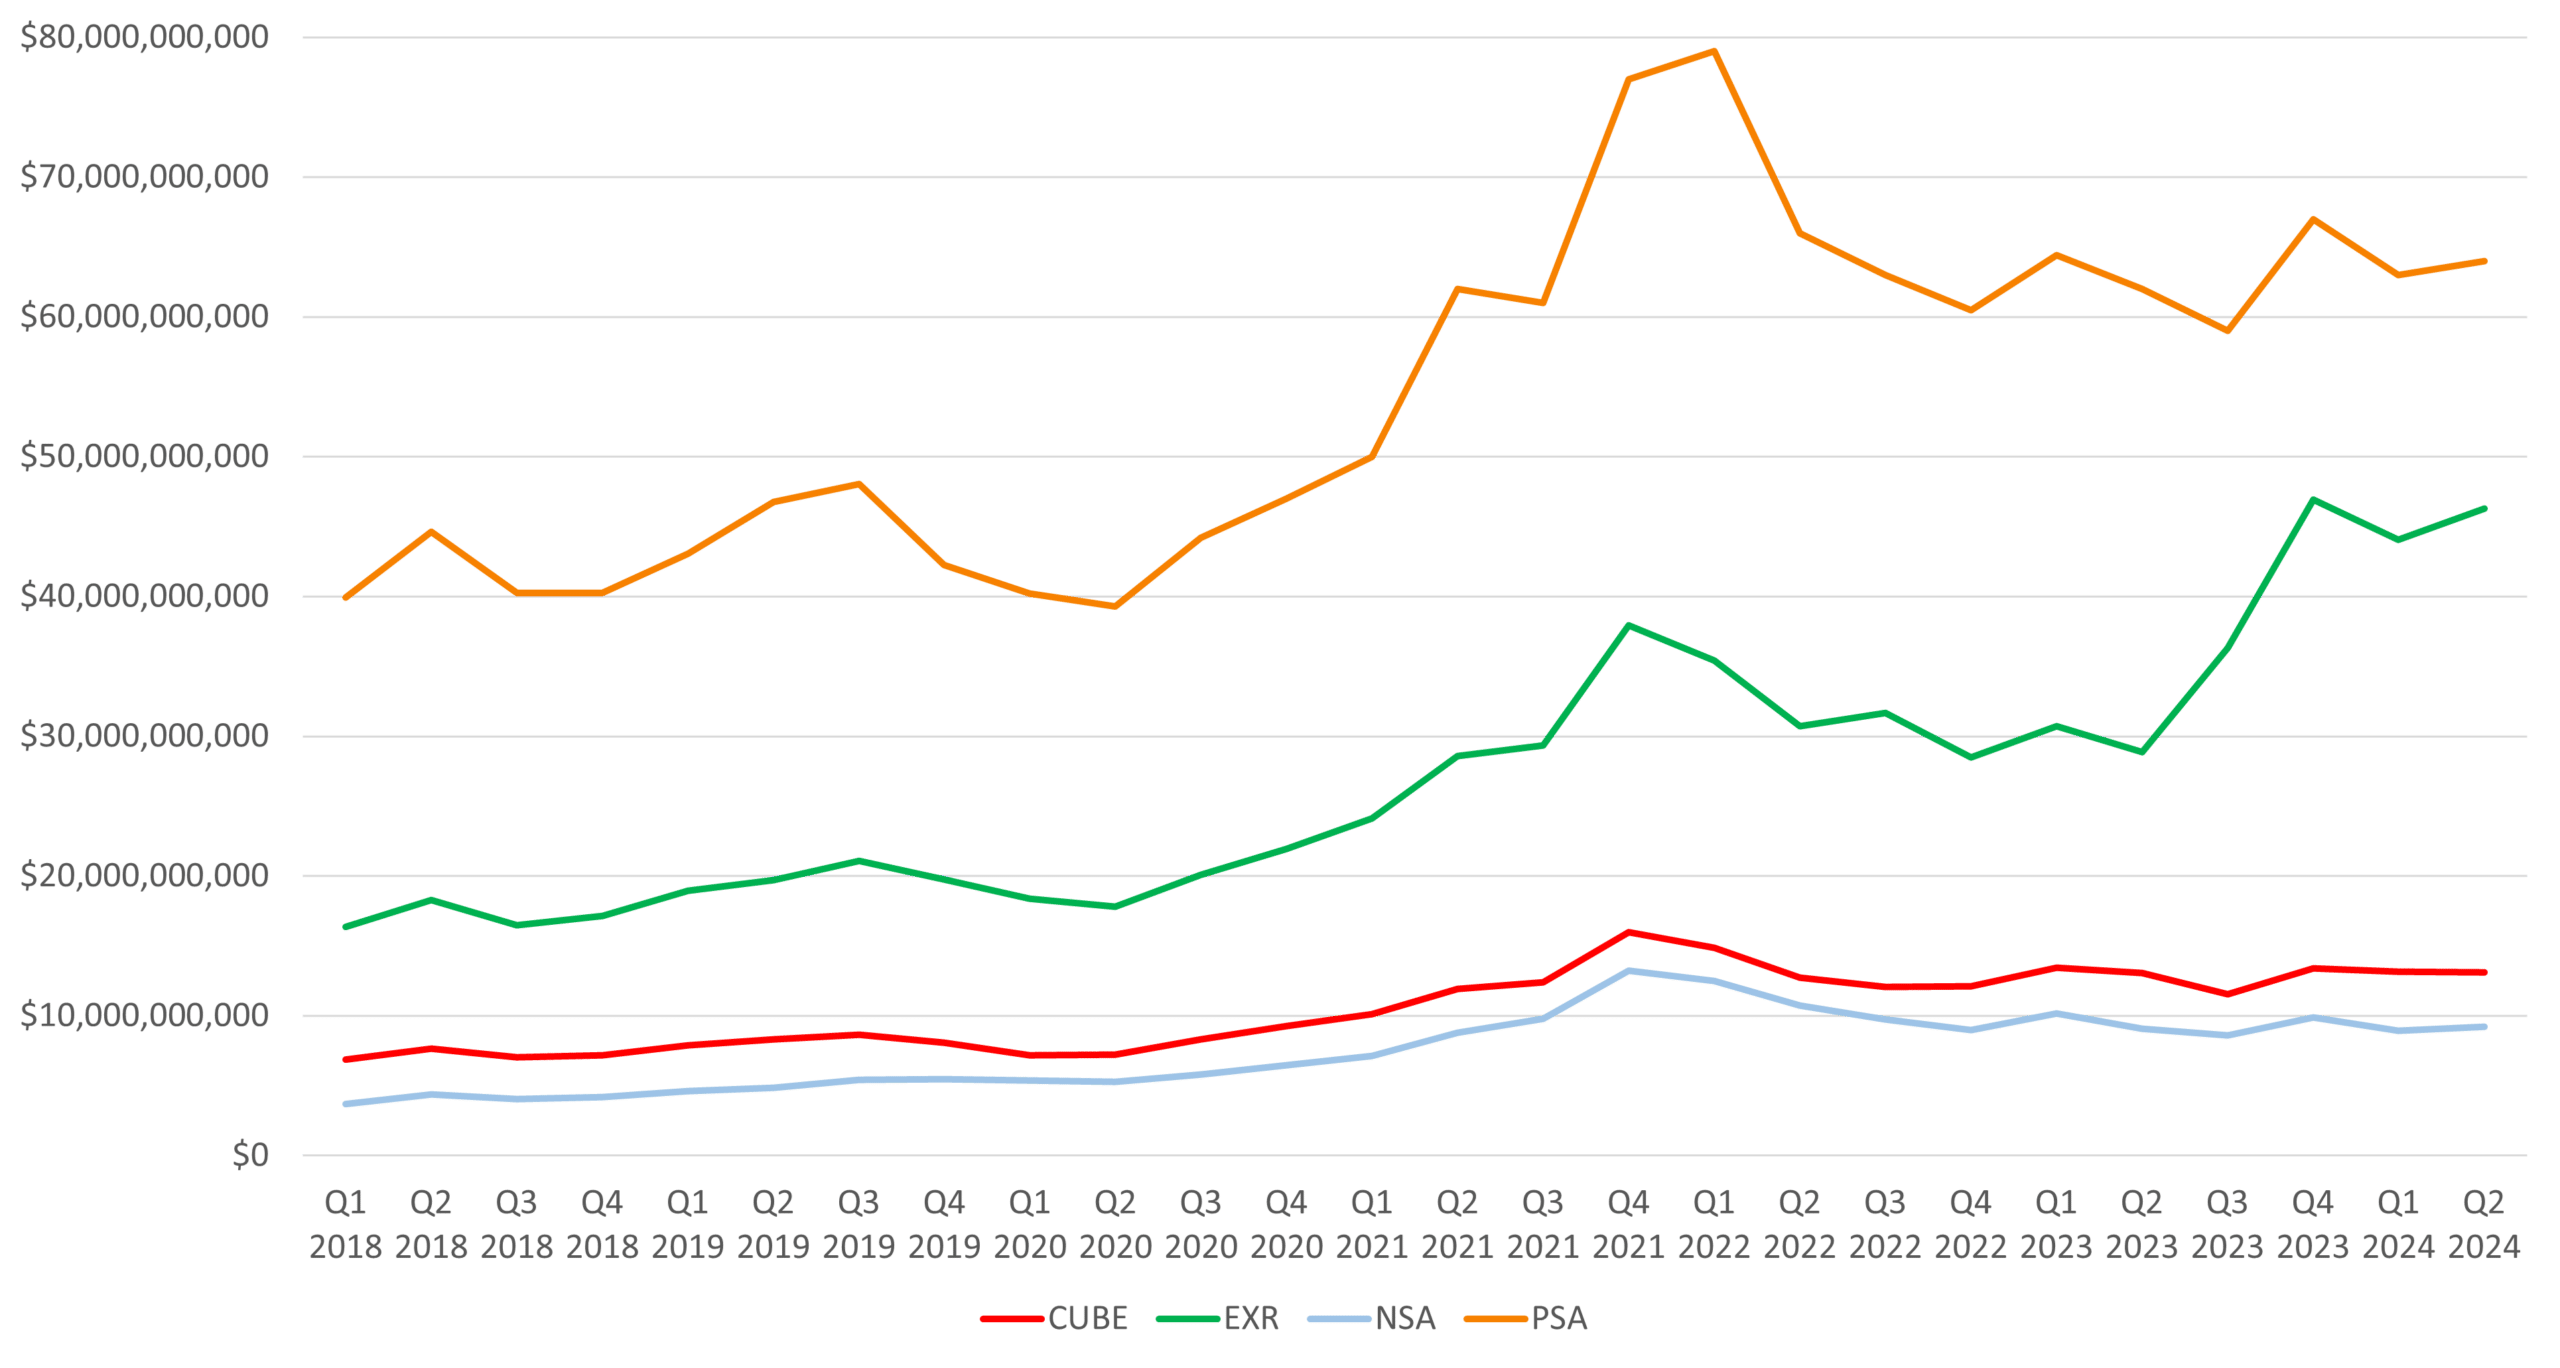
Enterprise Value History
Headwinds in the Self-Storage Market
The self-storage sector faces multiple headwinds, including declining move-in rates and rising operational costs. Public Storage and CubeSmart both reported challenges due to competitive pressures and market volatility. The broader economic environment, including inflation and rising interest rates, adds further complexity, leading to more conservative investment and operational strategies. NSA noted specific challenges in underperforming markets like Florida, where oversupply and weaker demand have exacerbated the impact of these headwinds. Despite these challenges, the REITs are focused on stabilizing operations and preparing for future growth opportunities.
Tailwinds in the Self-Storage Market
Several tailwinds are supporting the sector, including strong in-place customer behavior and reduced new competitive supply in certain markets. Public Storage’s non-same-store pool achieved significant NOI growth, with a projected 32% increase for 2024. CubeSmart’s expanding third-party management platform provided a consistent income stream, and Extra Space’s operational efficiencies, including aggressive solar initiatives, supported stable performance. NSA benefited from strategic cost management and strong capital positions, enabling these REITs to invest in growth and maintain robust financial health.
This summary incorporates detailed data metrics to provide a comprehensive understanding of the current state of the self-storage REIT market, highlighting the specific challenges and opportunities faced by the major players in the industry.
Q2 2024 Self-Storage REIT Data by MSA
| Average Occupancy Same Store | Achieved Rate Same Store | |||||||||||
| EXR | CUBE | PSA | NSA | Average | EXR | CUBE | PSA | NSA | Average | |||
| Atlanta, GA | 89.10% | 93.60% | 82.40% | 88.20% | 88.33% | Atlanta, GA | $16.82 | $17.91 | $13.93 | $17.50 | $16.54 | |
| Austin, TX | 89.90% | 93.30% | 84.80% | - | 89.33% | Austin, TX | $18.14 | $18.00 | $16.85 | - | $17.66 | |
| Baltimore, MD | 93.60% | - | - | 93.90% | 93.75% | Baltimore, MD | $22.44 | - | - | $23.11 | $22.78 | |
| Boston, MA | 90.50% | 95.20% | - | - | 92.85% | Boston, MA | $25.56 | $27.73 | - | - | $26.65 | |
| Bridgeport, CT | 91.10% | - | - | - | 91.10% | Bridgeport, CT | $29.45 | - | - | - | $29.45 | |
| Brownsville, TX | - | - | 89.20% | - | 89.20% | Brownsville, TX | - | - | $13.20 | - | $13.20 | |
| Charleston, SC | 90.80% | 95.60% | - | - | 93.20% | Charleston, SC | $16.65 | $17.70 | - | - | $17.18 | |
| Charlotte, NC | 90.90% | - | - | 92.10% | 91.50% | Charlotte, NC | $18.05 | - | - | $15.99 | $17.02 | |
| Chicago, IL | 92.50% | 93.40% | - | 93.60% | 93.17% | Chicago, IL | $19.07 | $20.31 | - | $20.44 | $19.94 | |
| Cincinnati, OH | - | 94.30% | - | - | 94.30% | Cincinnati, OH | - | $13.81 | - | - | $13.81 | |
| Cleveland, OH | 88.60% | - | - | - | 88.60% | Cleveland, OH | $17.28 | - | - | - | $17.28 | |
| Colorado Springs, CO | - | - | 87.30% | - | 87.30% | Colorado Springs, CO | - | - | $13.45 | - | $13.45 | |
| Columbus, OH | 92.50% | 92.50% | - | - | 92.50% | Columbus, OH | $13.78 | $12.39 | - | - | $13.09 | |
| Dallas, TX | 93.20% | 95.00% | 84.20% | 90.20% | 90.65% | Dallas, TX | $17.88 | $18.02 | $14.13 | $18.21 | $17.06 | |
| DC | 92.70% | 95.10% | - | 93.60% | 93.80% | DC | $25.95 | $24.01 | - | $26.70 | $25.55 | |
| Denver, CO | 93.20% | 94.20% | - | - | 93.70% | Denver, CO | $18.37 | $18.52 | - | - | $18.45 | |
| Ft Myers, FL | 86.50% | - | - | - | 86.50% | Ft Myers, FL | $21.28 | - | - | - | $21.28 | |
| Hawaii, HI | - | 94.10% | - | - | 94.10% | Hawaii, HI | - | $45.10 | - | - | $45.10 | |
| Hartford, CT | 90.20% | - | - | - | 90.20% | Hartford, CT | $17.88 | - | - | - | $17.88 | |
| Houston, TX | 93.10% | 93.60% | 88.20% | 91.80% | 91.68% | Houston, TX | $17.17 | $16.92 | $12.77 | $16.88 | $15.94 | |
| Indianapolis. IN | - | 92.00% | - | - | 92.00% | Indianapolis. IN | - | $11.94 | - | - | $11.94 | |
| Jacksonville, FL | 92.80% | - | - | - | 92.80% | Jacksonville, FL | $20.58 | - | - | - | $20.58 | |
| Las Vegas, NV | 91.60% | 93.80% | 87.10% | - | 90.83% | Las Vegas, NV | $18.76 | $17.43 | $14.57 | - | $16.92 | |
| Los Angeles, CA | 92.20% | 94.30% | 87.10% | 95.10% | 92.18% | Los Angeles, CA | $27.30 | $30.06 | $24.67 | $35.96 | $29.50 | |
| Louisville, KY | - | 90.10% | - | - | 90.10% | Louisville, KY | - | $11.75 | - | - | $11.75 | |
| Memphis, TN | - | 93.10% | - | - | 93.10% | Memphis, TN | - | $12.32 | - | - | $12.32 | |
| McAllen, TX | - | - | 90.40% | - | 90.40% | McAllen, TX | - | - | $13.49 | - | $13.49 | |
| Miami, FL | 93.00% | 94.10% | - | 93.40% | 93.50% | Miami, FL | $25.21 | $27.83 | - | $29.98 | $27.67 | |
| Nashville, TN | 92.10% | - | - | - | 92.10% | Nashville, TN | $16.14 | - | - | - | $16.14 | |
| New Orleans, LA | - | - | 82.20% | - | 82.20% | New Orleans, LA | - | - | $15.56 | - | $15.56 | |
| New York | 91.40% | 94.10% | - | 93.80% | 93.10% | New York | $36.98 | $29.75 | - | $32.19 | $32.97 | |
| Norfolk, VA | - | 94.50% | - | - | 94.50% | Norfolk, VA | - | $18.31 | - | - | $18.31 | |
| OKC, OK | - | - | 87.60% | - | 87.60% | OKC, OK | - | - | $10.89 | - | $10.89 | |
| Orlando, FL | 91.70% | 93.50% | - | 91.90% | 92.37% | Orlando, FL | $16.99 | $17.42 | - | $18.81 | $17.74 | |
| Philadelphia, PA | 91.70% | 93.10% | - | 93.50% | 92.77% | Philadelphia, PA | $20.90 | $20.82 | - | $21.00 | $20.91 | |
| Phoenix, AZ | 90.80% | 94.10% | 84.00% | - | 89.63% | Phoenix, AZ | $16.76 | $17.36 | $16.22 | - | $16.78 | |
| Portland. OR | - | 95.70% | 89.20% | - | 92.45% | Portland. OR | - | $19.67 | $18.68 | - | $19.18 | |
| Providence, RI | 91.30% | - | - | - | 91.30% | Providence, RI | $20.11 | - | - | - | $20.11 | |
| Richmond, VA | - | 94.40% | - | - | 94.40% | Richmond, VA | - | $18.55 | - | - | $18.55 | |
| Riverside, CA | 90.00% | - | 86.80% | - | 88.40% | Riverside, CA | $19.40 | - | $16.36 | - | $17.88 | |
| Sacramento, CA | 91.50% | 94.40% | - | - | 92.95% | Sacramento, CA | $18.05 | $20.67 | - | - | $19.36 | |
| San Antonio, TX | 89.00% | - | 83.80% | - | 86.40% | San Antonio, TX | $16.66 | - | $15.36 | - | $16.01 | |
| San Diego, CA | 92.20% | - | - | - | 92.20% | San Diego, CA | $26.27 | - | - | - | $26.27 | |
| San Fransisco, CA | - | 94.70% | - | 94.90% | 94.80% | San Fransisco, CA | - | $35.10 | - | $32.58 | $33.84 | |
| Sarasota, FL | - | - | 84.40% | - | 84.40% | Sarasota, FL | - | - | $21.04 | - | $21.04 | |
| Seattle, WA | - | - | - | 93.50% | 93.50% | Seattle, WA | - | - | - | $25.43 | $25.43 | |
| Tampa, FL | 91.90% | 93.60% | - | - | 92.75% | Tampa, FL | $20.27 | $20.25 | - | - | $20.26 | |
| Toucson, AZ | 90.20% | - | - | - | 90.20% | Toucson, AZ | $16.97 | - | - | - | $16.97 | |
| Tulsa, OK | - | - | 87.10% | - | 87.10% | Tulsa, OK | - | - | $11.17 | - | $11.17 | |
| West Palm Beach, FL | - | - | - | 92.70% | 92.70% | West Palm Beach, FL | - | - | - | $26.16 | $26.16 | |
| Other | 89.80% | 94.40% | 86.00% | 93.30% | 90.88% | Other | $19.17 | $17.72 | $15.27 | $18.33 | $17.62 | |
| Total | 91.50% | 94.10% | 86.40% | 93.00% | 91.25% | Total | $22.47 | $21.63 | $15.66 | $22.54 | $20.58 | |
Contributors
Steven Paul
Senior Financial Analyst
Aaron Sanchez
Managing Director
Scott Schoettlin
Managing Director