SkyView By The Numbers
25
Current Self-Storage Team Members
87
Self-Storage Facilities Currently Under Representation
$780,126,000
Self-Storage Volume Currently Under Representation
31
Self-Storage Facilities Under Representation in top 40 mSAs
36
Self-Storage Facilities Coming to Market Soon in Top 40 MSAs
Q3 Self-Storage REIT Highlights
- Urban Market Success: CubeSmart’s New York City borough portfolio recorded a 7.4% year-over-year rental increase, showcasing strong urban demand and resilience despite broader market challenges.
- Strategic Marketing Investments: CubeSmart increased marketing expenses by 10% year-to-date to drive top-of-funnel demand, resulting in a 26% rise in web sales traffic during Q3.
- Growth in Third-Party Management: CubeSmart added 24 stores to its third-party management platform in Q3, bringing the total to 893, reinforcing its position as a leading manager in the sector.
Brand Integration Progress: Early benefits from rebranding Life Storage properties include improved SEO, conversion rates, and marketing efficiencies.
Growth in Management and Loans: Added 124 net third-party managed stores YTD, with 100 more expected by year-end; bridge loan program expanded with $158M in Q3.
Strong Occupancy Amid Challenges: October occupancy at 94.3% (EXR) and 93.2% (LSI), with high readiness to capitalize on market recovery.
Occupancy Gains Post-Hurricane: NSA’s Florida stores experienced a 600-basis-point occupancy boost following hurricanes Helene and Milton, particularly in Tampa and Sarasota-Bradenton.
PRO Internalization Progress: The integration of PRO-managed stores is 85% complete, with full transition expected by December, already showing benefits in occupancy and rate management.
Acquisitions Activity: Closed $148M in acquisitions and identified $100M–$200M in potential asset recycling opportunities for 2025.
Stabilizing Operations: Move-in rents improved, down only 5% year-over-year in October compared to 16% in Q1, with strong customer retention and lower move-outs.
Digital Adoption: 75% of new leases completed digitally via eRental, with nearly 2 million users on the PS app driving efficiency and convenience.
Sustainability Focus: Achieved 30% utility reduction, over 800 solar-powered properties, targeting 1,300 by 2025, alongside record $430M in 2024 development deliveries.
Thoughts from the CEO's
CubeSmart
Christopher P. Marr
President & Chief Executive Officer
- “Our lower beta urban markets continue to outperform the Sun Belt. In the overall New York MSA, rentals were up year-over-year, demonstrating the continued solid demand profile in this key urban market. This increase was led by our portfolio in the New York City boroughs, up 7.4%, offset by rentals being down 11.6% in our Northern New Jersey portfolio. As we move forward, we remain disciplined in our capital allocation decisions and are prepared to move decisively and with conviction for opportunities that fit our investment thesis.”
Extra Space Storage
Joseph D. Margolis
Chief Executive Officer
- “We’re leveraging our scale, optimizing store performance, and driving growth through our ancillary businesses. The move to a single brand for the Life Storage portfolio is already delivering tangible benefits, and we are well-positioned to seize opportunities as market fundamentals improve.”
National Storage Affiliates
David Cramer
President & Chief Executive Officer
- “The transition of PRO stores is not just about systems; it’s about unlocking growth. Early results in markets like Phoenix and Las Vegas demonstrate that our revenue and customer acquisition strategies are working. Combined with strong acquisition opportunities and an improving transaction market, we are setting the stage for 2025 to be a year of growth and optimization.”
Public Storage
Joseph D. Russell, Jr
President, Chief Executive Officer
- “As we anticipated, operating fundamentals are stabilizing across our portfolio and the broader industry. Pricing for new customers is stabilizing, with move-in rents down 9% year-over-year in the third quarter and 5% in October. This is a meaningful improvement from the first quarter of this year, when move-in rents were down 16%. Our in-place customers are behaving very well, with payment patterns strong, average length of stay long, and move-outs down year-to-date. With move-in rents down nearly 30% since 2022, we’ve become even more affordable relative to other space alternatives. Stabilization should fundamentally lead to improvement.”
Macroeconomic Highlights
Recession Fears and Economic Outlook:
Economic uncertainty continues to weigh heavily on sentiment as the U.S. economy faces growing concerns about a potential recession. While GDP growth remained positive in Q3, the Federal Reserve’s aggressive interest rate hikes aimed at reining in inflation have sparked fears of a slowdown. Consumer spending, a key driver of economic activity, has shown resilience but is expected to decelerate as excess pandemic-era savings are depleted and borrowing costs rise. The labor market, while still robust, is beginning to show signs of strain, with an uptick in delinquencies among subprime borrowers and the resumption of federal student loan payments adding further pressure to household budgets. Despite these headwinds, pockets of optimism persist, driven by continued investment in infrastructure and technology sectors.
Geopolitical Tensions and Their Impact on CRE:
The commercial real estate (CRE) market is navigating the ripple effects of recent geopolitical tensions and evolving federal policies following the U.S. presidential election. With shifts in corporate tax structures, environmental mandates, and infrastructure spending, investors are closely monitoring policy changes that could significantly impact industrial, office, and multifamily real estate. Stricter regulations and potential tax increases have prompted stakeholders to reassess long-term strategies.
Moreover, Federal Reserve interest rate policies and economic stimulus measures remain critical factors influencing CRE investment decisions. These dynamics contributed to a cautious market in Q3, with transaction activity slowing as participants adjusted to the post-election policy landscape and its implications for 2025 and beyond.
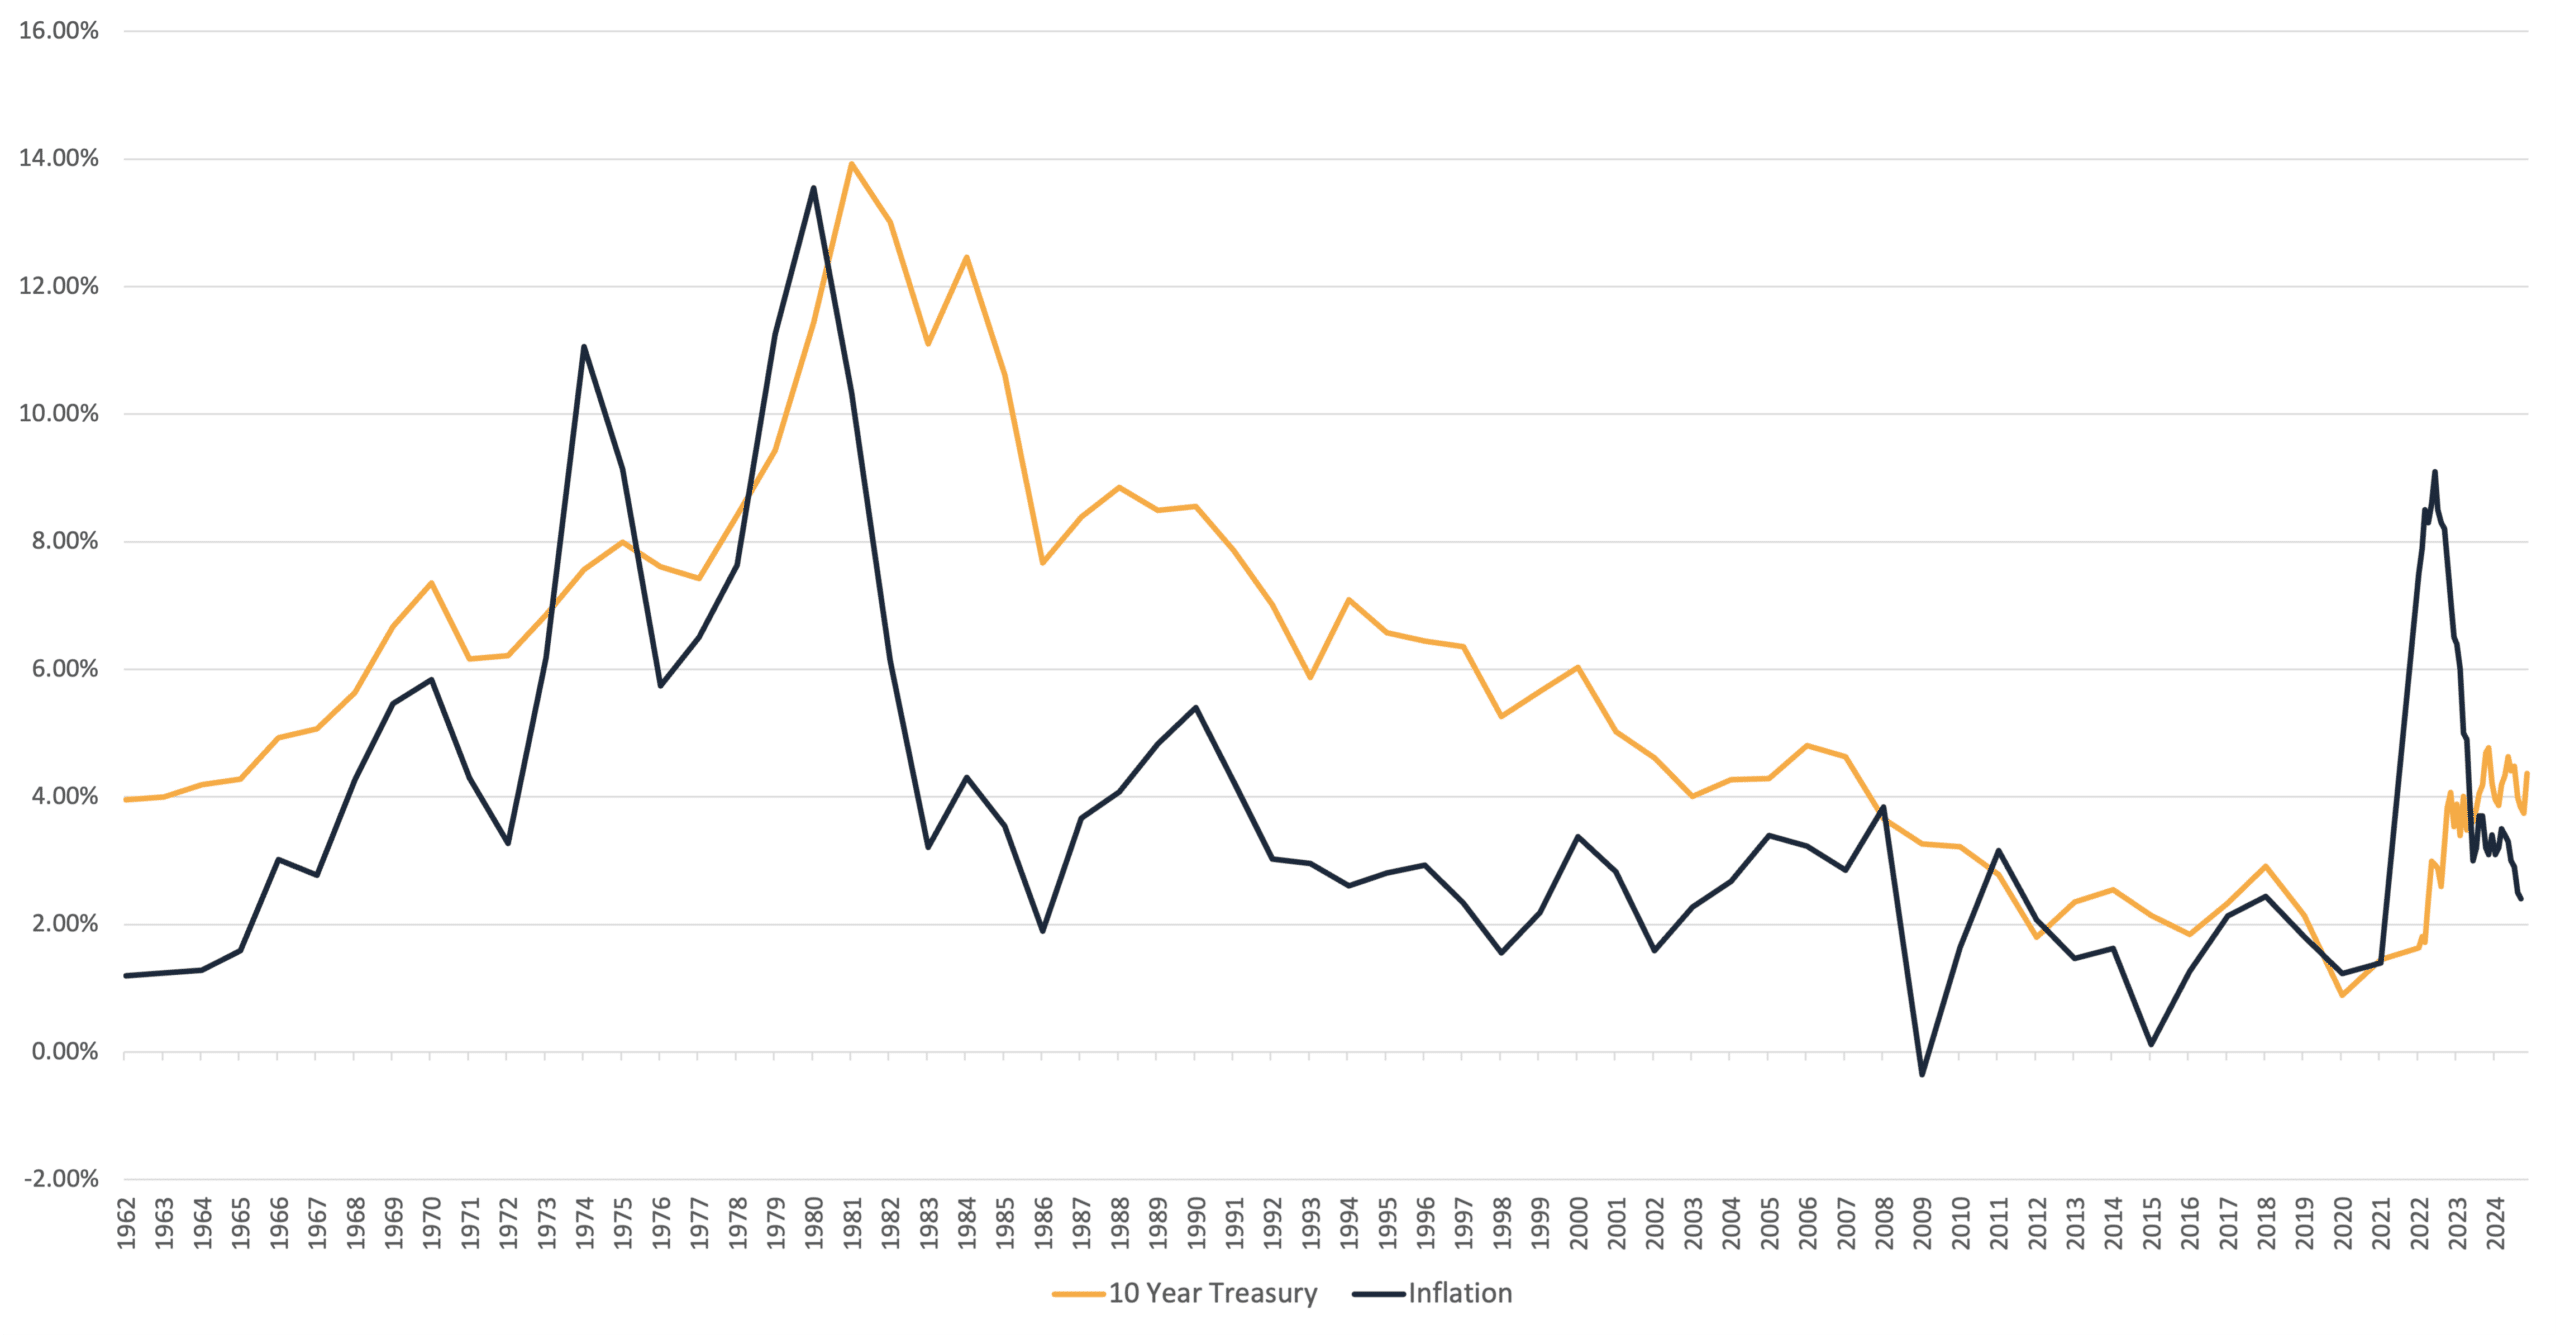
Inflation and the 10-year Treasury Since 1962
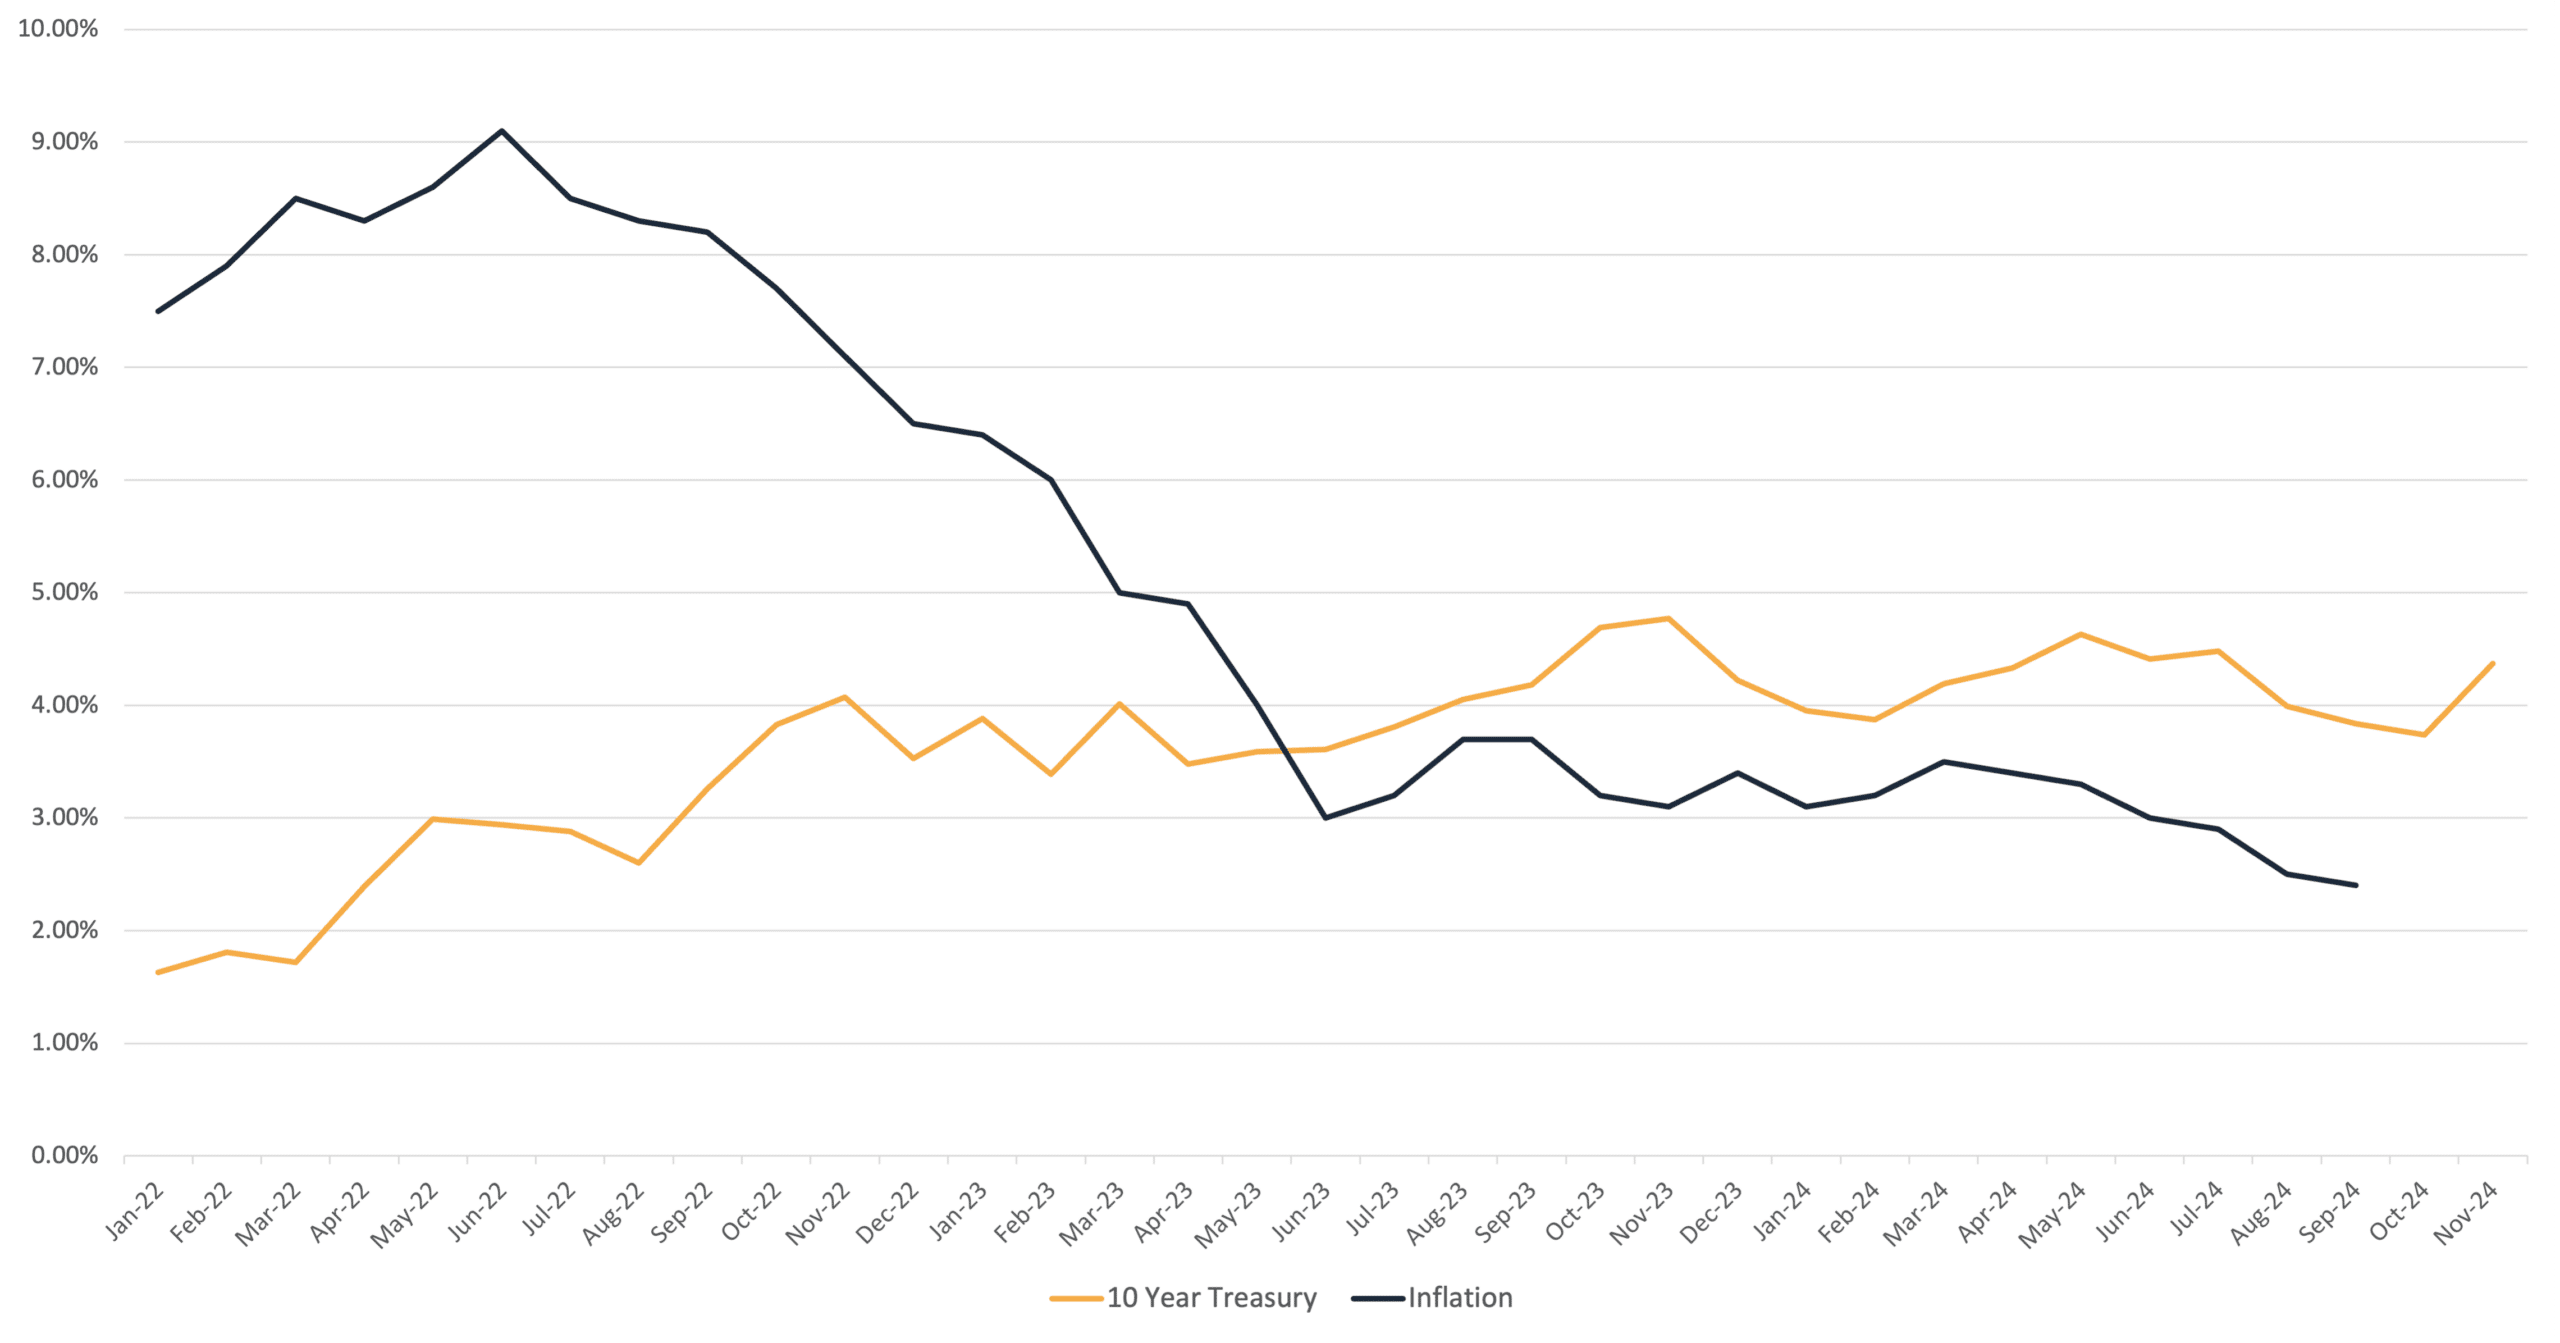
Inflation and the 10-year Treasury Since 2022
Q3 2024 Self-Storage REIT Data Overview
| Same Store Ending Occupancy | Same Store YoY Revenue Increase | Same Store YoY Expense Increase | Same Store YoY NOI Increase | Same Store Achieved Rate | Q3 Acquisitions | ||||||||
| 2024 | 2023 | 2024 | 2023 | 2024 | 2023 | 2024 | 2023 | 2024 | 2023 | % Change | 2024 | 2023 | |
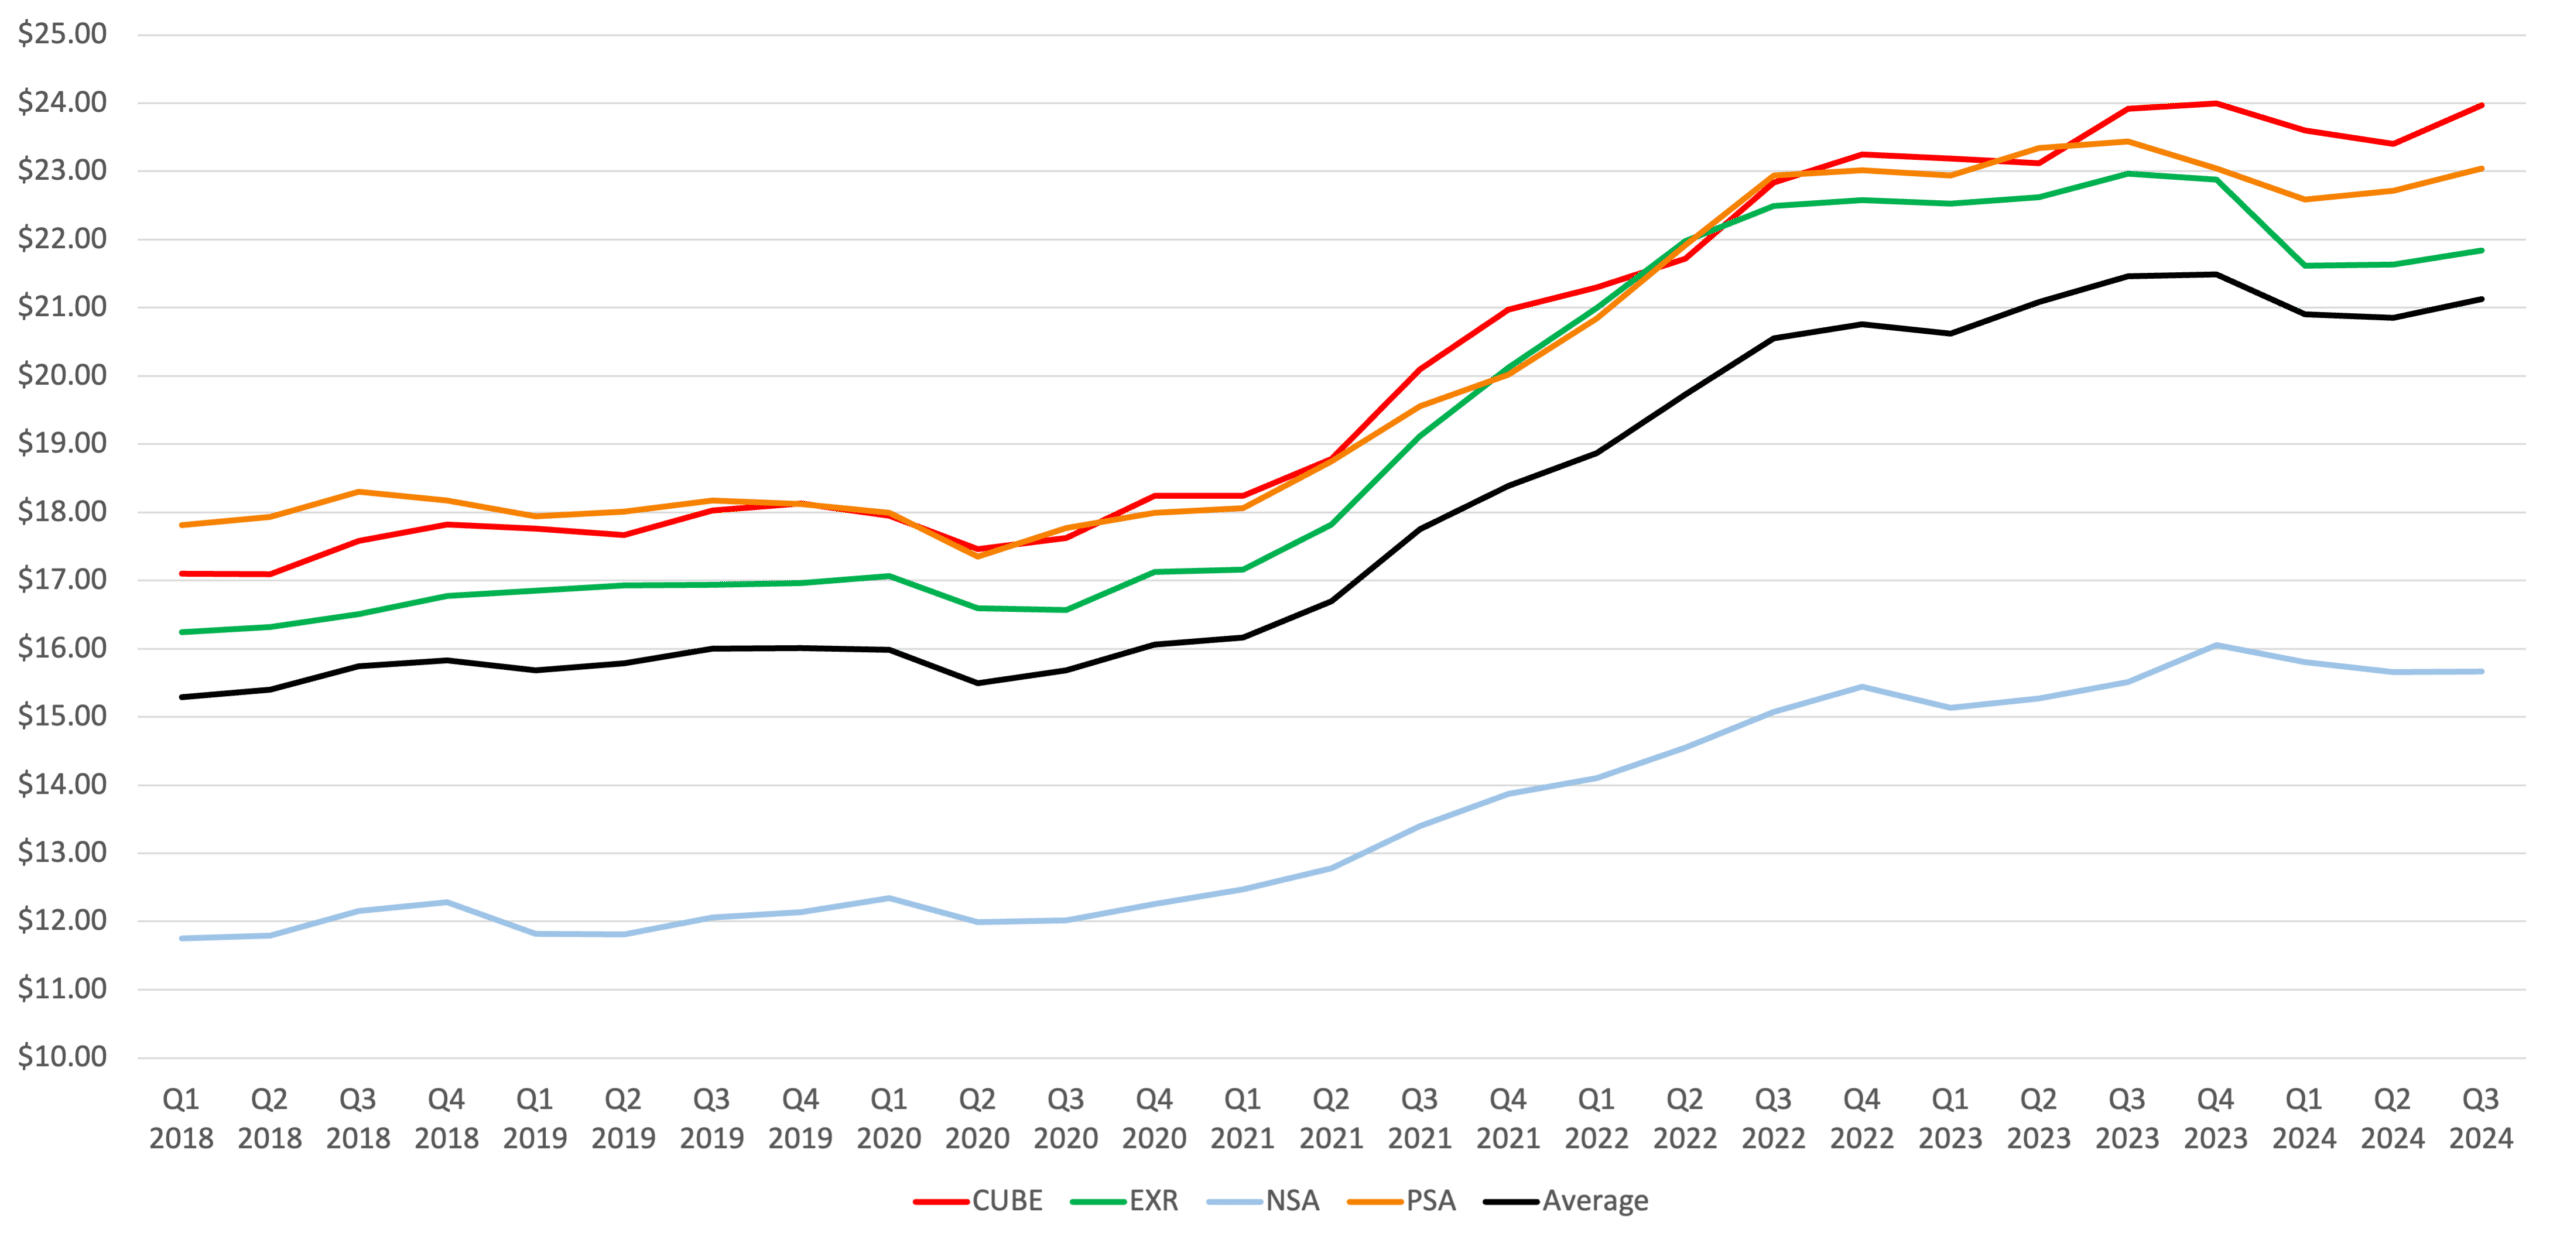
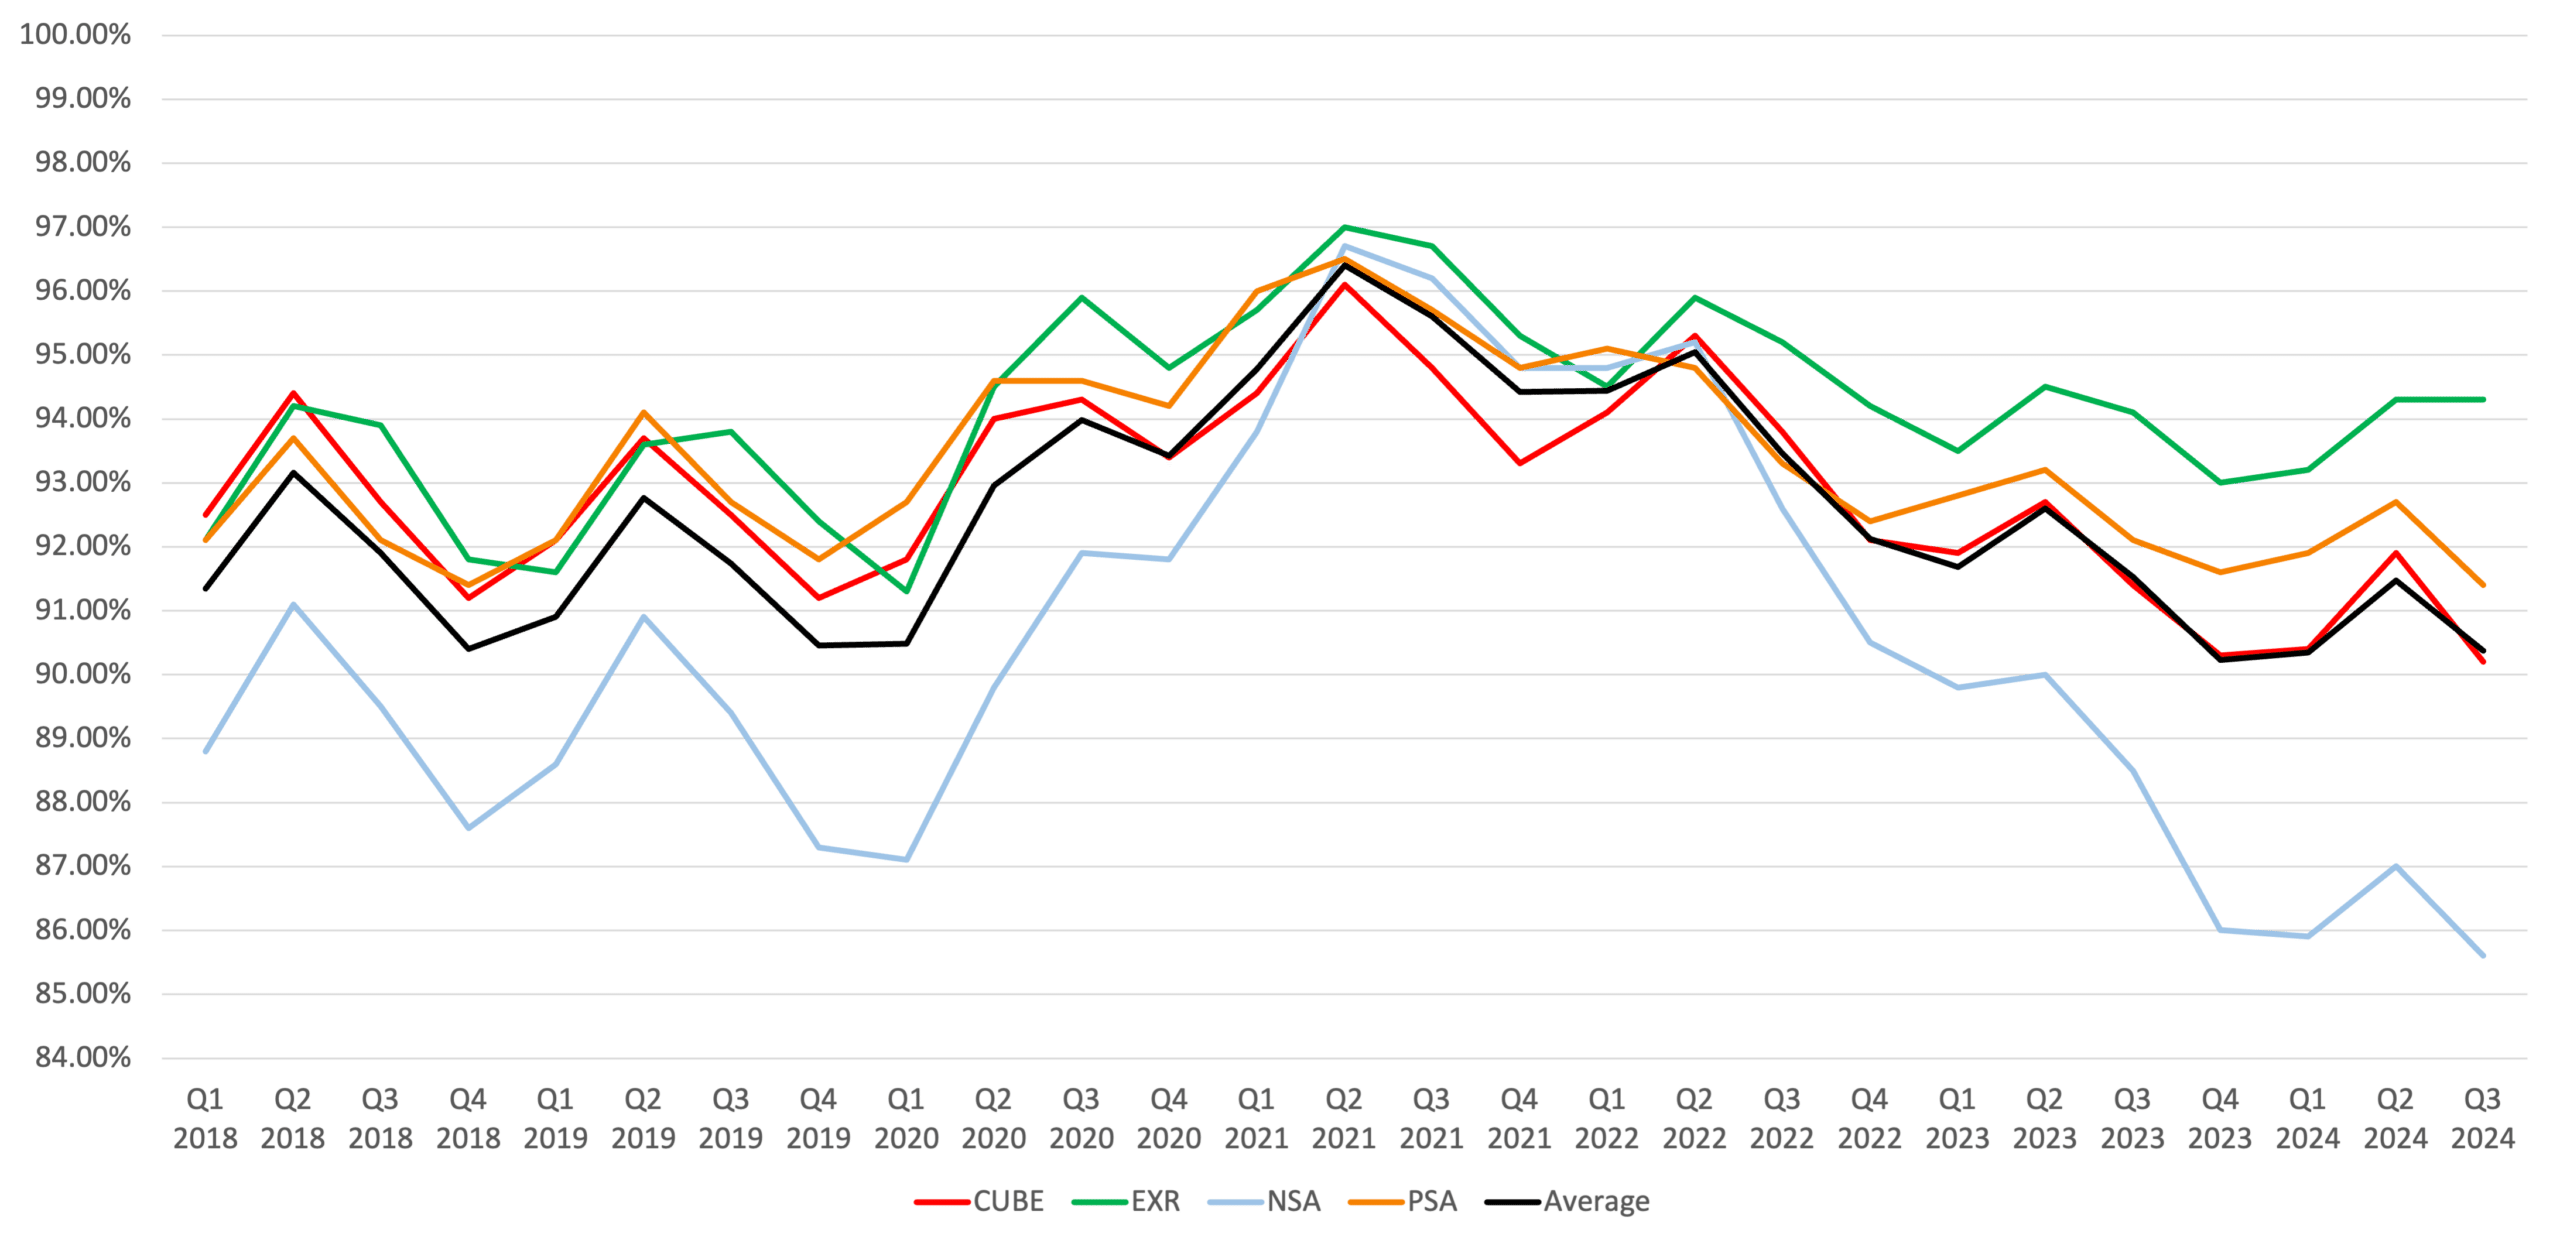
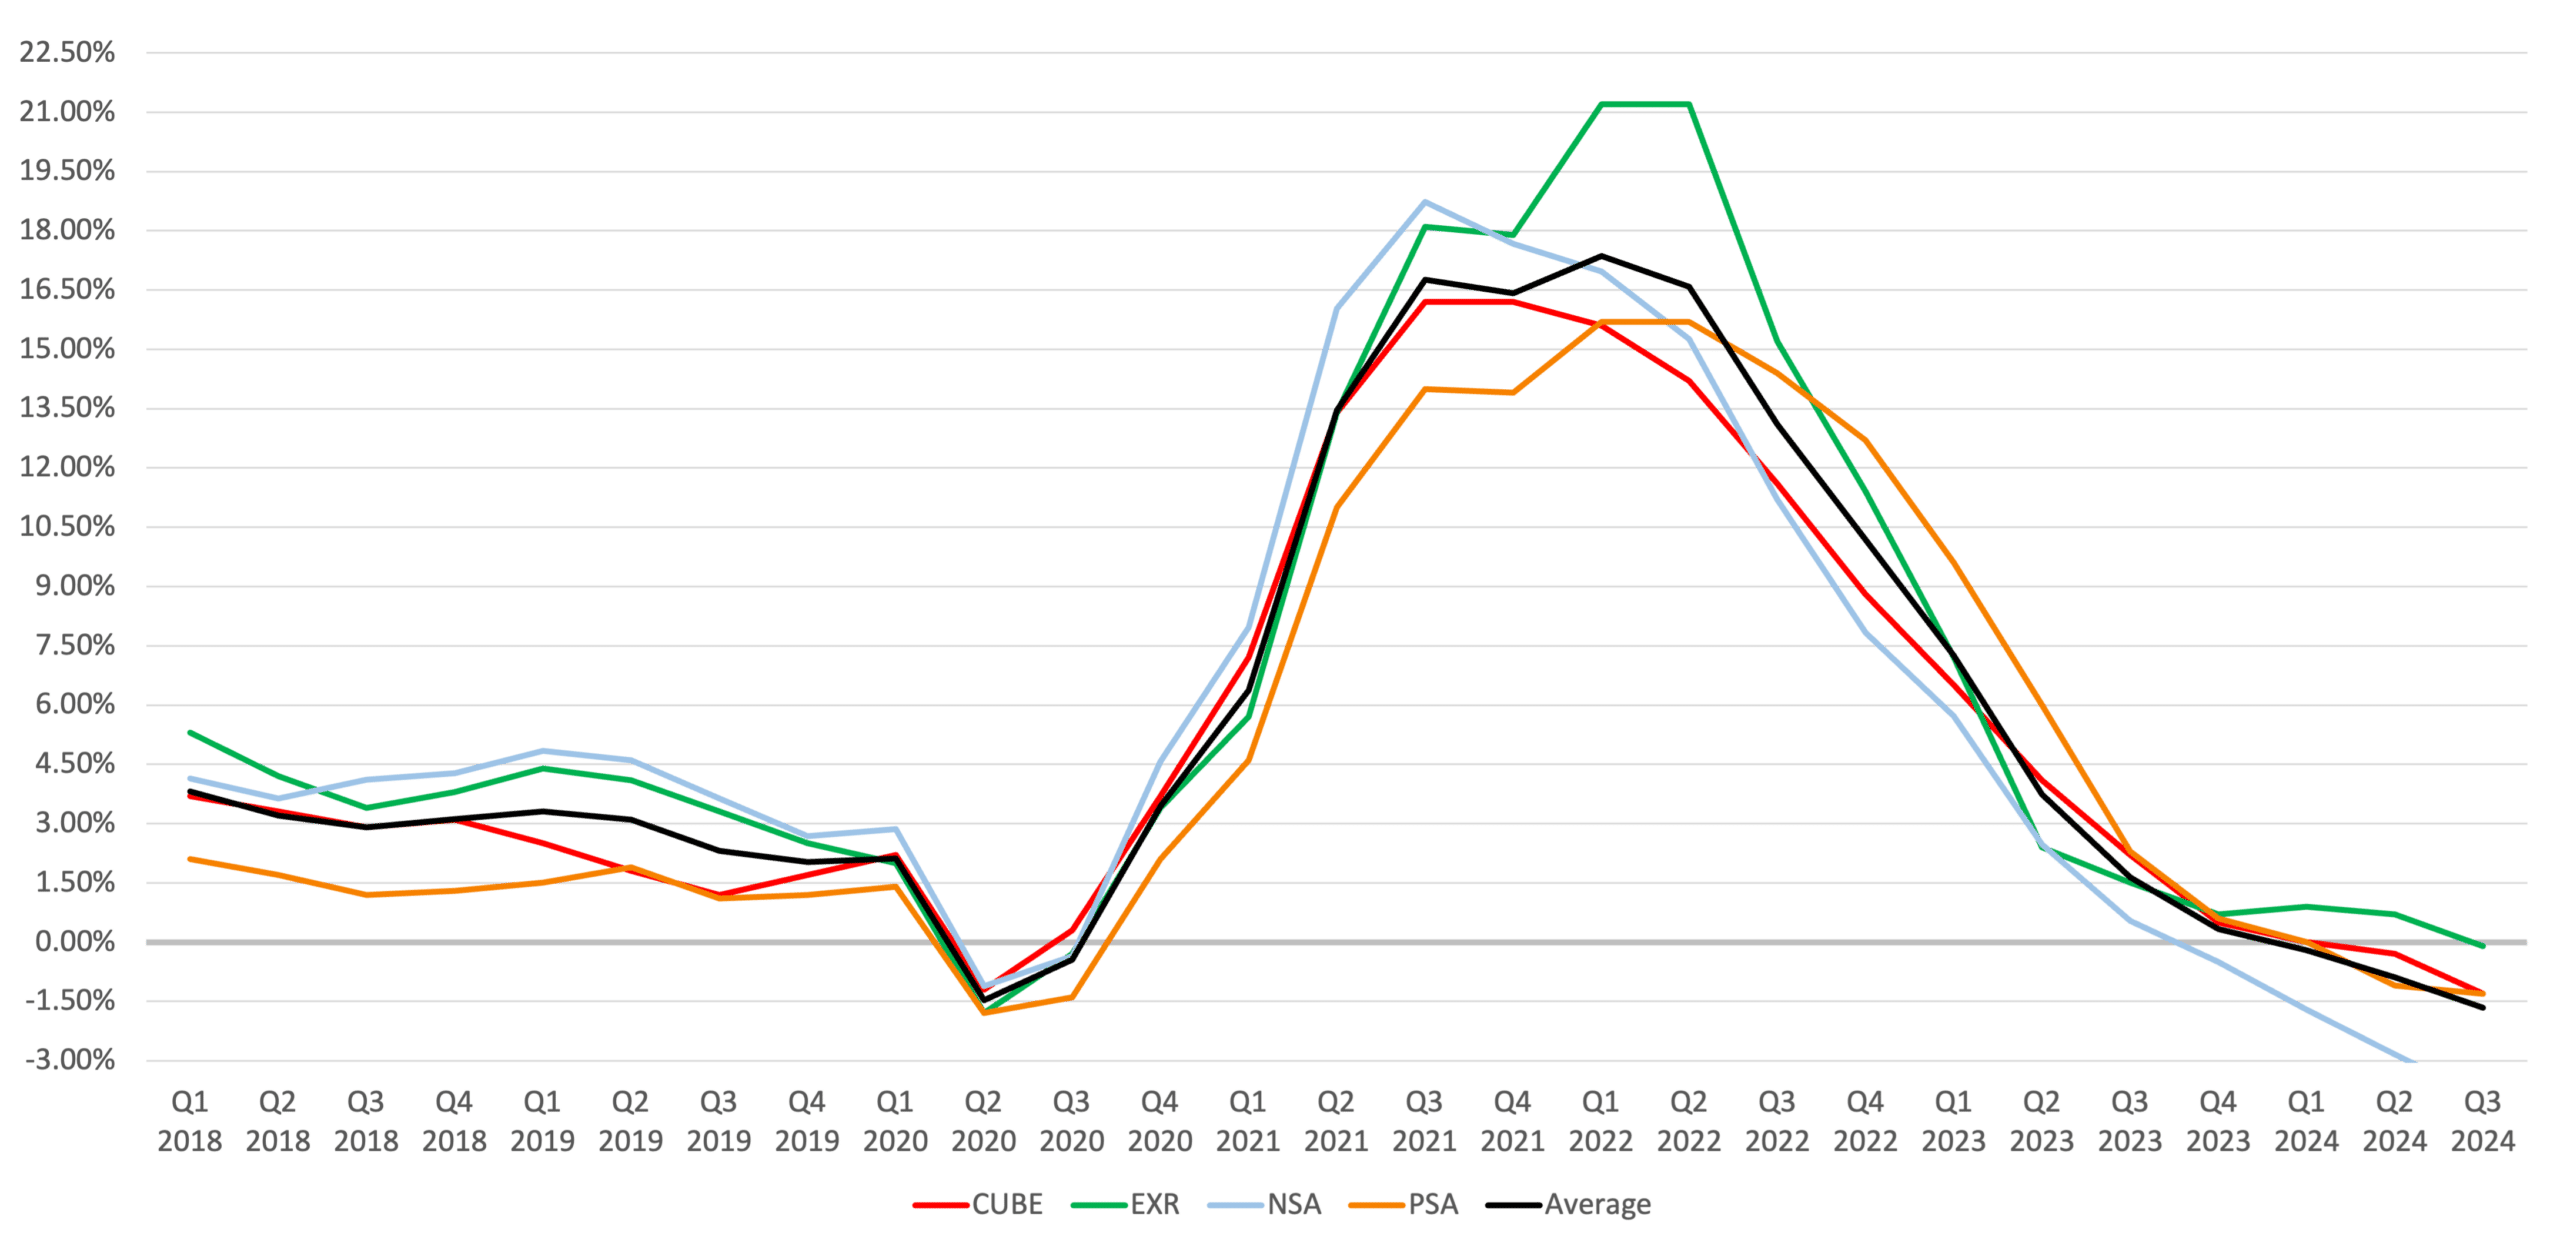
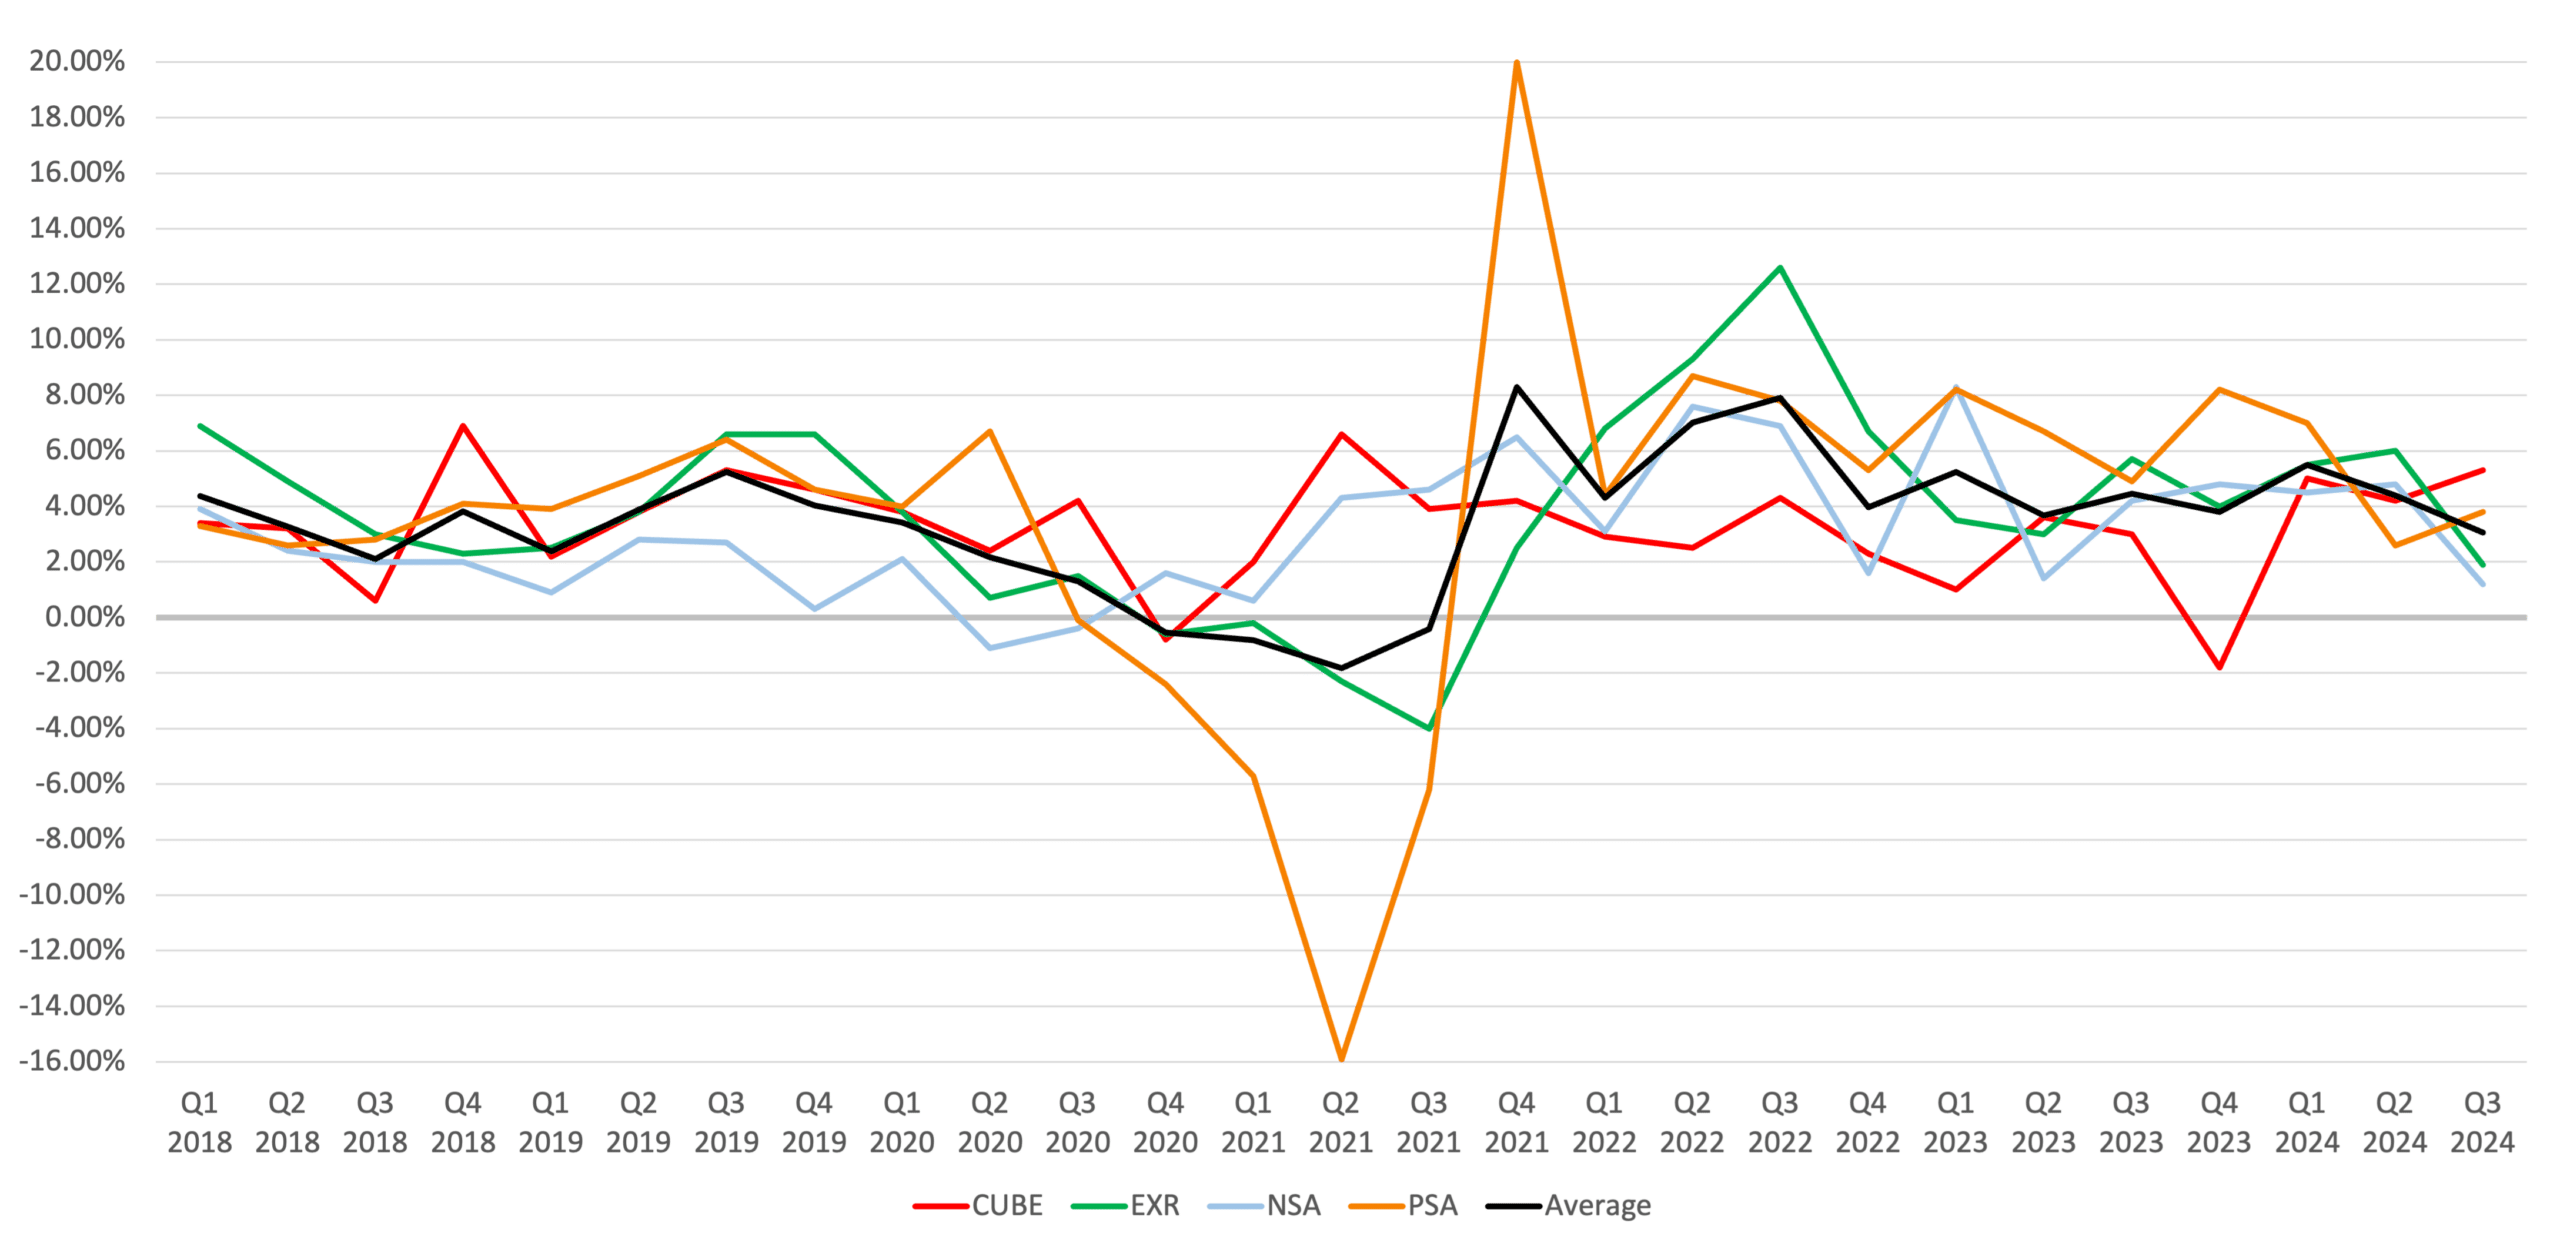
| CUBE | 90.20% | 91.40% | -1.30% | 2.20% | 5.30% | 3.00% | -3.10% | 2.00% | $23.97 | $23.92 | 0.2% | 0 | 0 |
| EXR | 94.30% | 94.10% | -0.10% | 1.50% | 1.90% | 5.70% | -1.00% | 0.70% | $21.84 | $22.97 | -4.9% | 11 | 1,200+ |
| NSA | 85.60% | 88.50% | -3.94% | 0.54% | 1.20% | 4.20% | -5.30% | -0.10% | $15.67 | $15.51 | 1.0% | 18 | 2 |
| PSA | 91.40% | 92.10% | -1.30% | 2.30% | 3.80% | 4.90% | -2.60% | 1.90% | $23.04 | $23.44 | -1.7% | 3 | 137 |
Q3 2024 Self-Storage Operating Fundamentals
Self-Storage Rental Rates
Self-storage REITs have been adjusting rental rates to balance occupancy and demand in a competitive environment. Extra Space Storage reported a 9% year-over-year decrease in new customer move-in rates in Q3 2024, which improved slightly in October. This decline aligns with industry trends, as Public Storage noted move-in rents were down 9% year-over-year in Q3, narrowing to a 5% decrease in October from a sharper 16% decrease at the year’s start. CubeSmart saw a 27.4% negative churn gap in Q3, with a move-in rate down 11% year-over-year by October. National Storage Affiliates reported the most significant rate pressure, with street rates declining around 17% year-over-year in Q3 across high-supply markets, especially in Sunbelt regions. Overall, REITs are focusing on capturing and stabilizing occupancy, leveraging pricing adjustments and balancing rent growth with occupancy retention to maintain revenue.
Achieved Rates (Same Store)
Self-Storage Occupancy
Occupancy levels have been relatively strong across the self-storage REIT sector, despite increased competition in high-supply markets. Extra Space achieved a robust 94.3% same-store occupancy at the end of Q3, marking a 20-basis-point increase over the previous year, indicating a successful strategy for tenant retention. Public Storage also maintained strong occupancy, though down 70 basis points year-over-year, but with high customer retention and a drop in move-outs. CubeSmart reported a period ending occupancy of 90.2% in Q3, down by 120 basis points compared to last year, largely due to increased supply in high-demand markets. In New York City, where CubeSmart operates a large urban portfolio, rental volume rose 7.4% year-over-year in the boroughs, offsetting declines in neighboring Northern New Jersey. National Storage Affiliates saw a 290-basis-point year-over-year decline in occupancy, ending at 85.6% for Q3.
Period Ending Occupancy (Same Store)
Self-Storage Income & Expenses
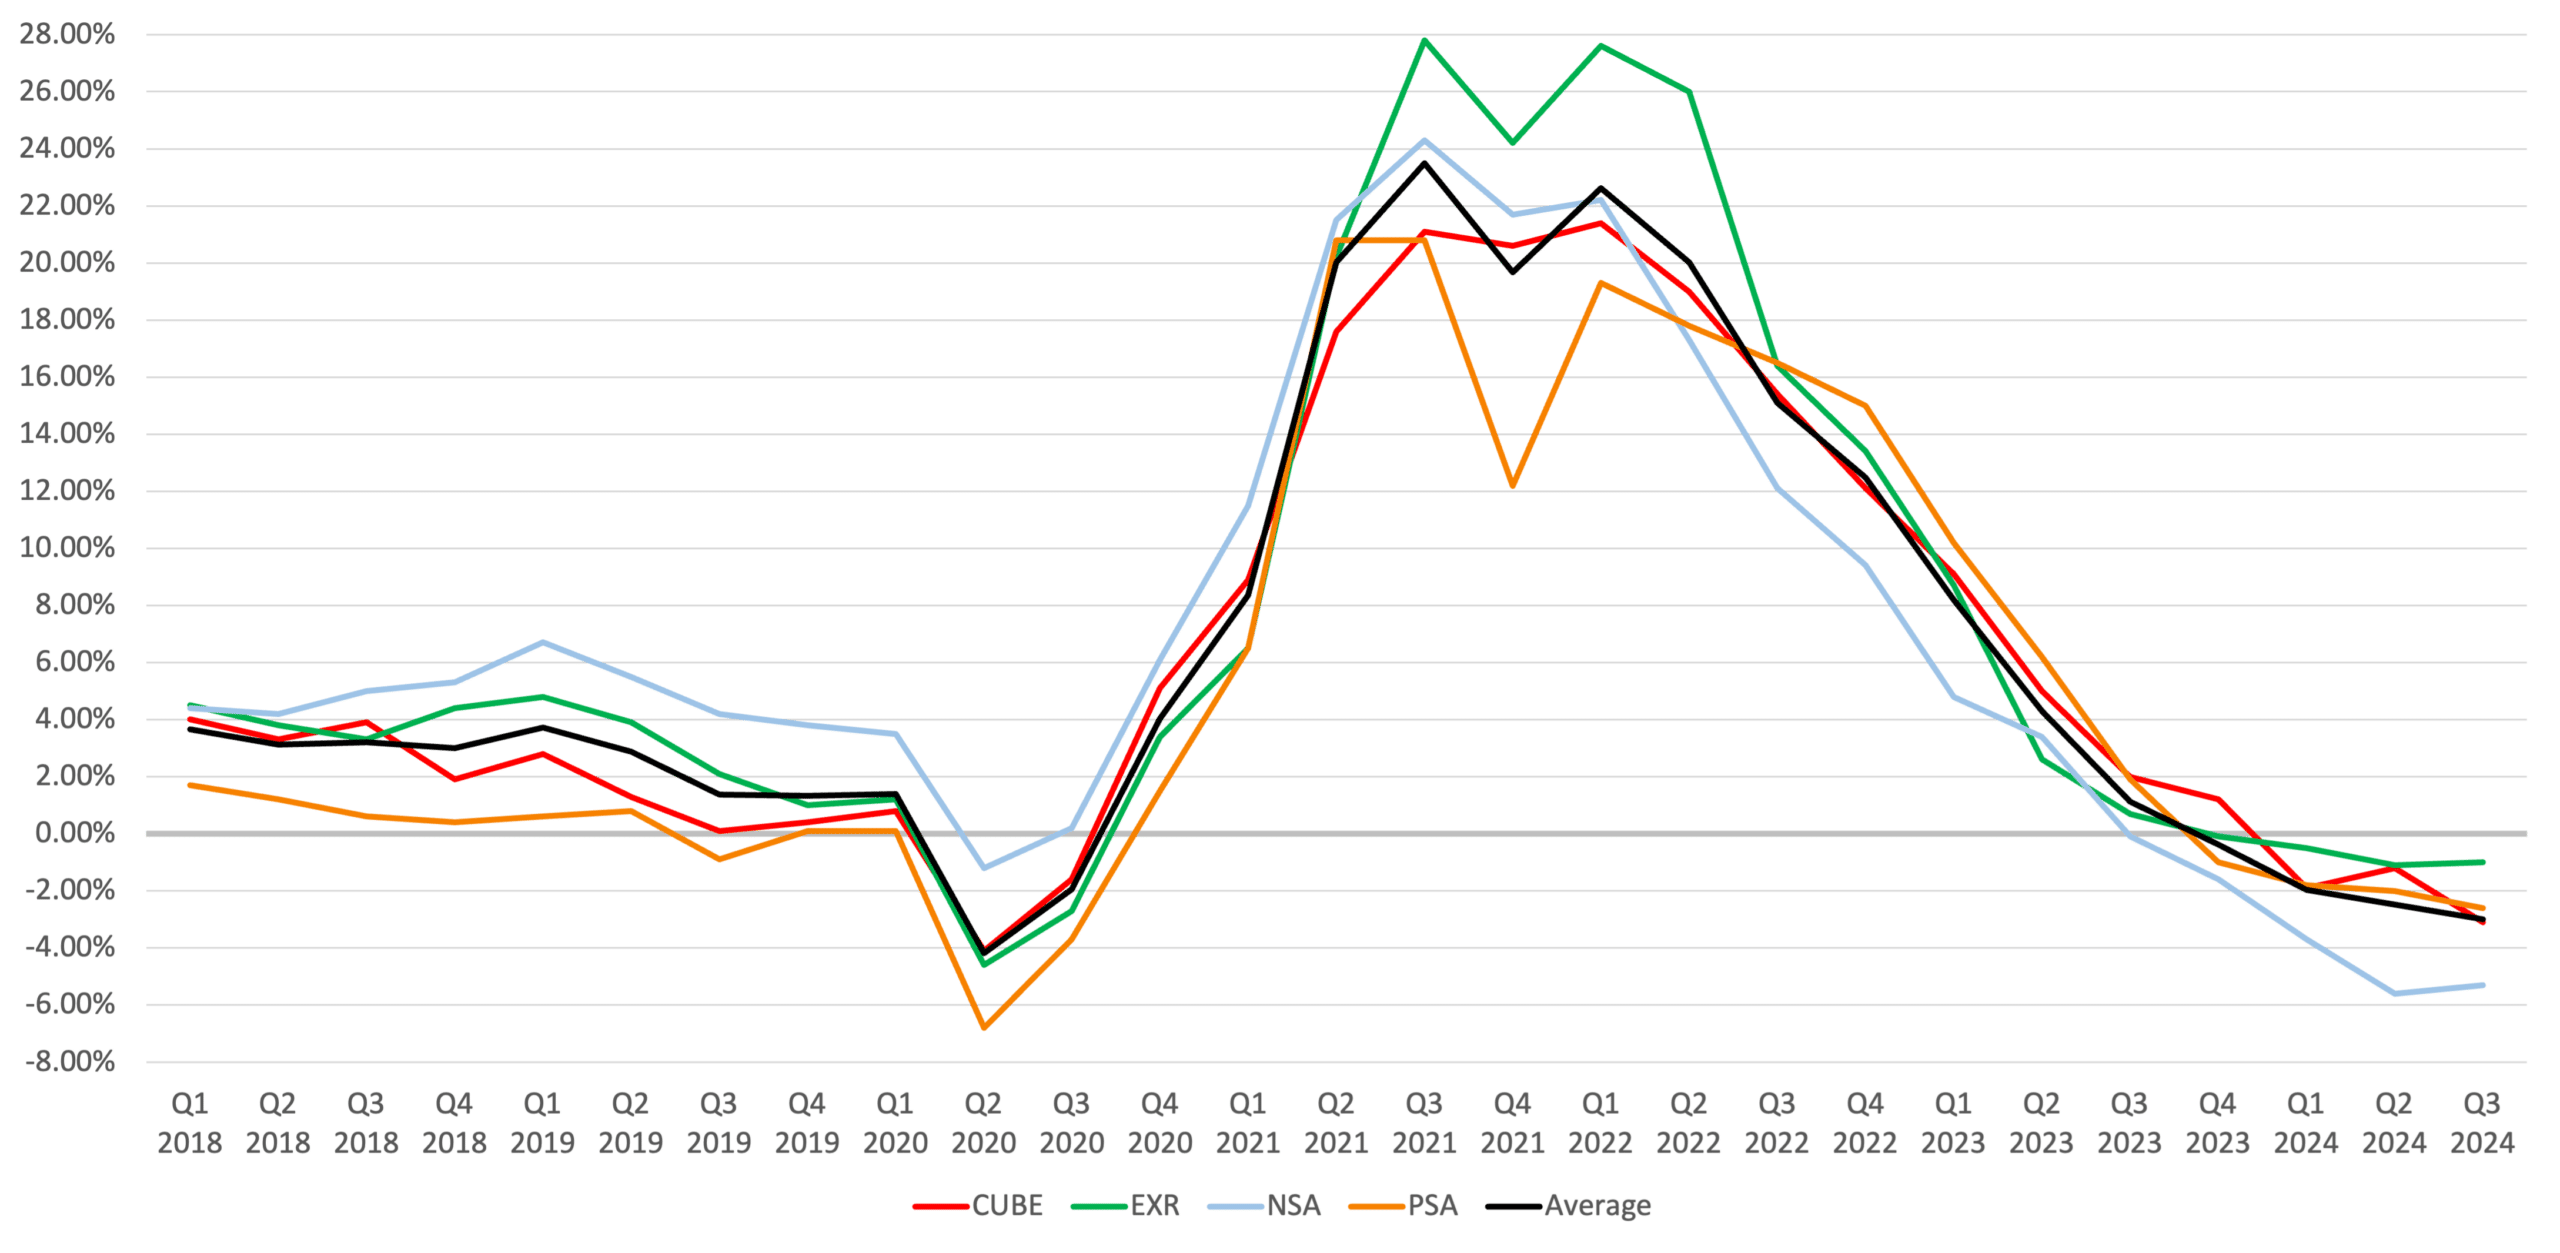
Self-storage REITs maintained relatively stable income but are grappling with rising expenses, particularly in property taxes, insurance, and marketing. Extra Space adjusted its full-year revenue guidance upward by 75 basis points, with same-store NOI guidance increased by 75 basis points despite an anticipated 25-basis-point rise in property tax expenses. Public Storage’s cost management initiatives included a 30% energy usage reduction through LED conversions and solar panel installations at over 800 properties, with a goal to extend this to 1,300 properties by 2025. CubeSmart’s marketing expenses increased by 5.3% in Q3 to drive demand, contributing to a 3.1% decline in same-store NOI. National Storage Affiliates managed a modest 1.2% increase in expenses, despite rising property tax and insurance costs, by cutting personnel and operational costs as part of its ongoing PRO integration. Overall, REITs have focused on expense management to mitigate the impact of inflationary pressures on operational expenses.
YoY Rental Income Growth (Same Store)
YoY Expense Growth (Same Store)
YoY NOI Growth (Same Store)
Self-Storage Investment & Transaction Activity
Investment activity among self-storage REITs remains high, with strategic acquisitions and expansions focusing on strong markets. Extra Space added 124 third-party managed stores year-to-date, with net additions of 38 stores in Q3, marking a record year for management growth outside the Life Storage merger. The REIT deployed $334 million in acquisitions through wholly-owned and joint ventures, focusing on yield-enhancing assets, with first-year yields at approximately 5% and stabilized yields at 6.5%. Public Storage noted an increase in acquisition opportunities as buyer-seller expectations align, projecting more deals in 2025 as the transaction market recovers. CubeSmart reported two properties under contract in strong markets, increasing its managed portfolio to 893 stores. National Storage Affiliates invested in a joint venture totaling $148 million in portfolio acquisitions in Texas and Oklahoma, with cap rates around 6%, aligning with the REIT’s goal of expanding in high-demand, high-density markets. This active investment environment reflects REITs’ strategic pursuit of assets that enhance portfolio quality and yield potential in a competitive but recovering market.
Acquisition Dollar Amount History
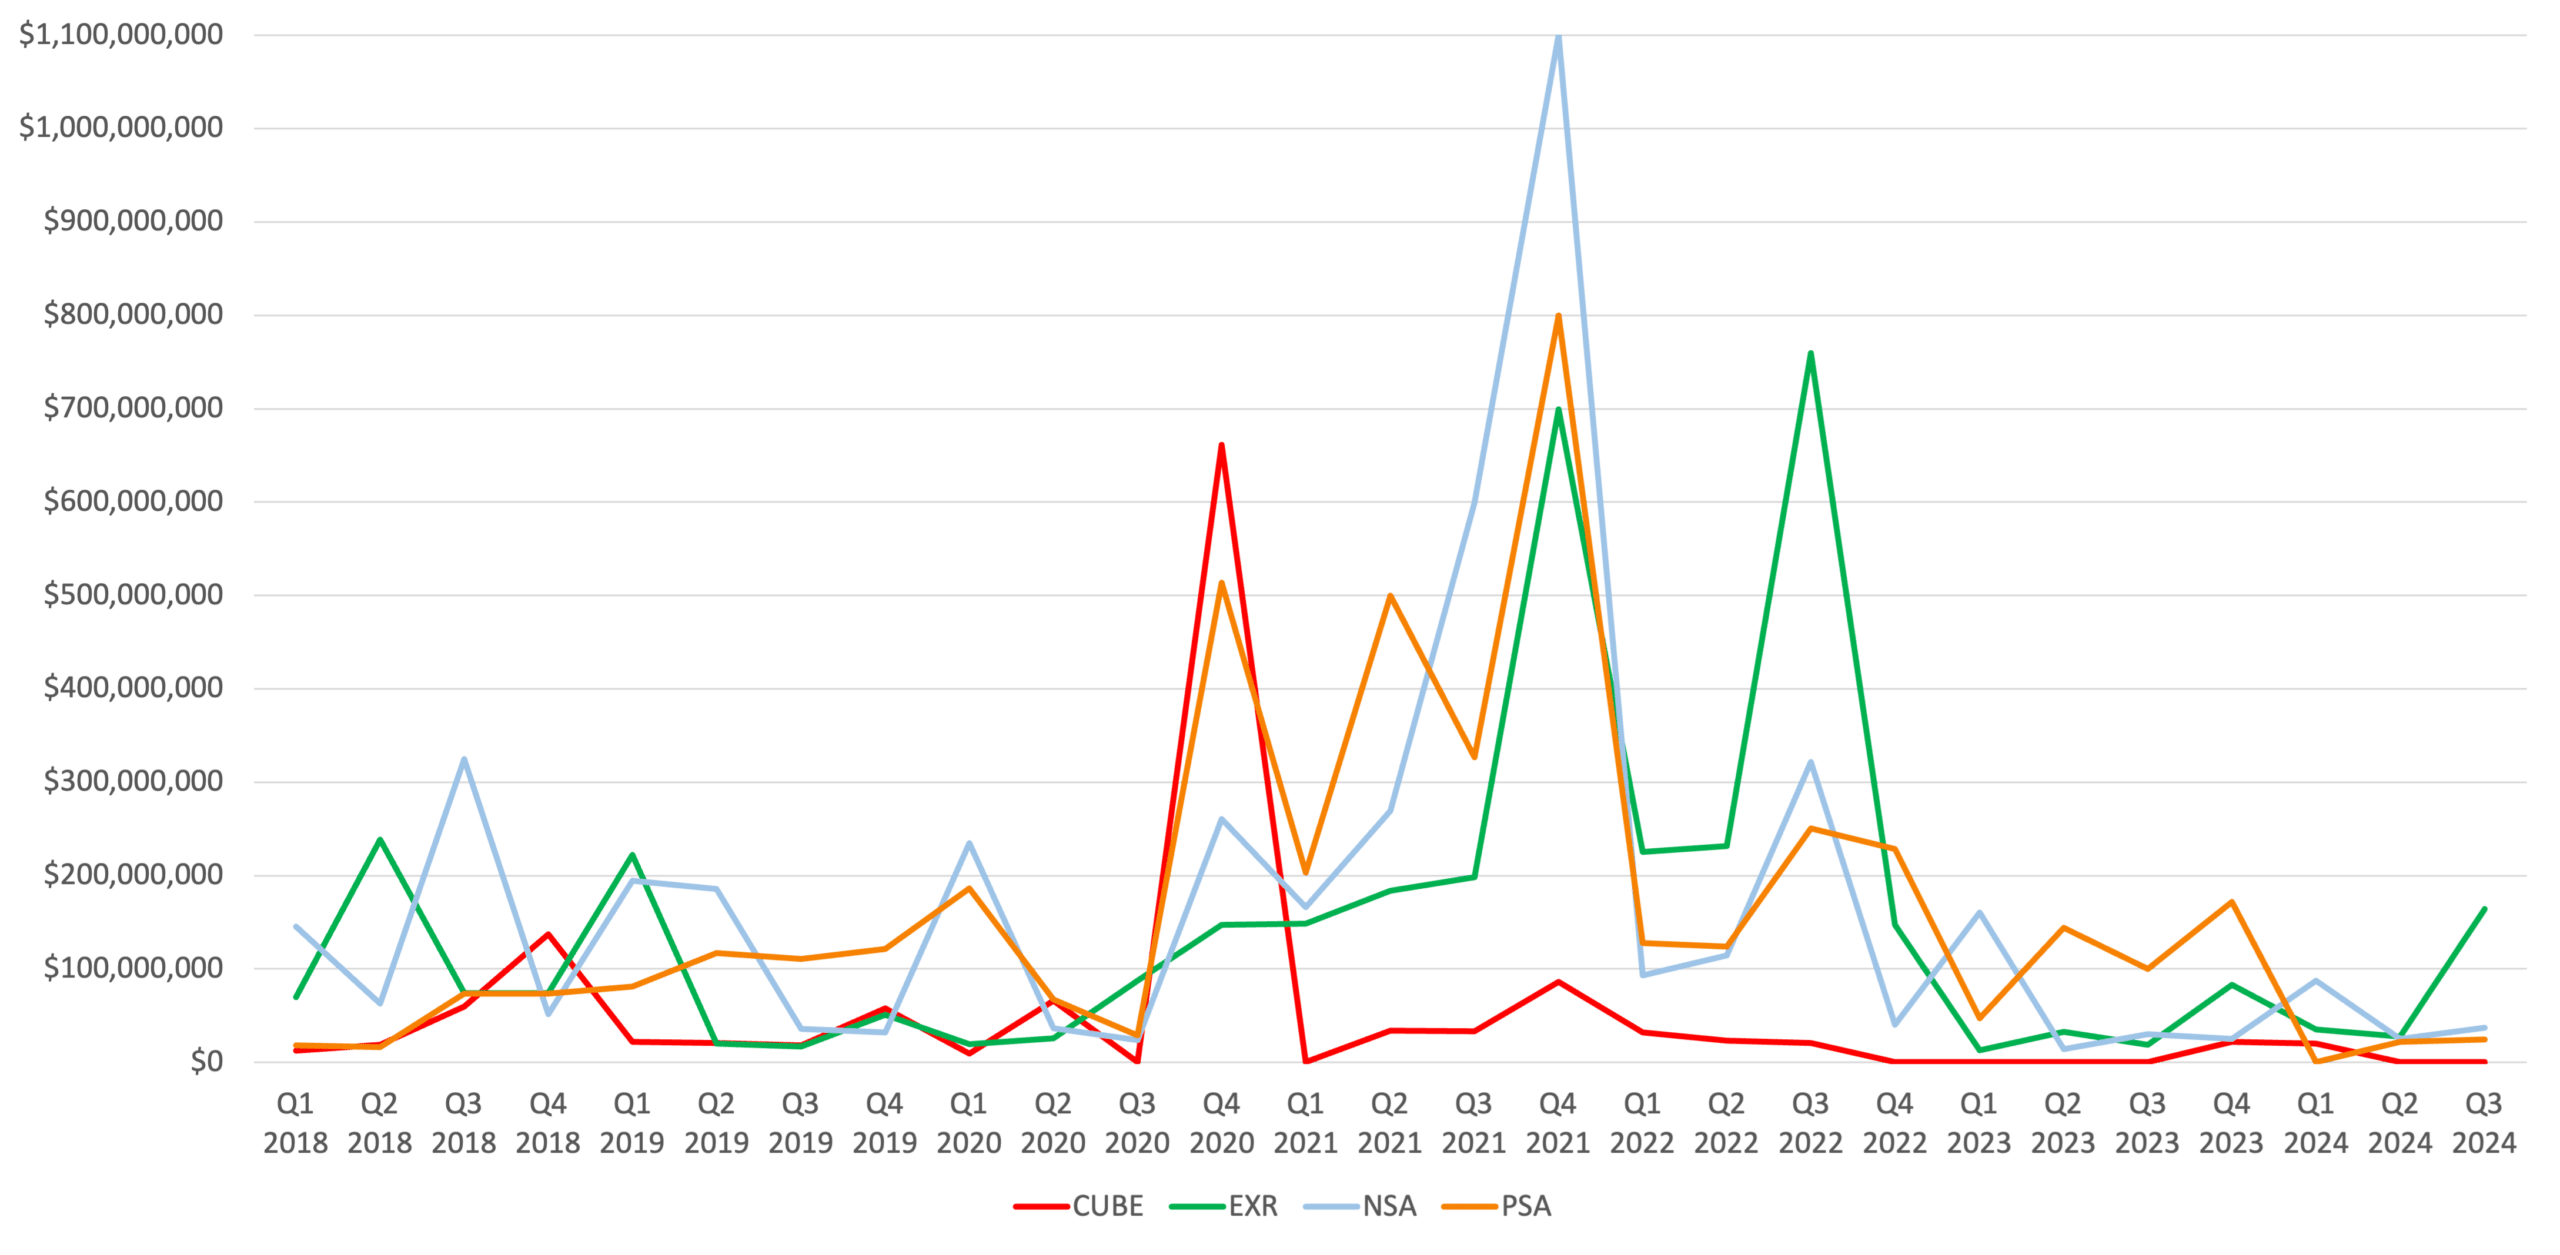
*Excludes PSA Acquisition of ezStorage in Q2 2021 for $1.8 Billion
*Excludes PSA Acquisition of All Storage in Q4 2021 for $1.5 Billion
*Excludes PSA Acquisition of Simply Storage in Q3 2023 for $2.2 Billion
*Excludes EXR Acquisition of Life Storage in Q3 2023 for $11.6 Billion
Self-Storage Monthly Transactions 2018-2024
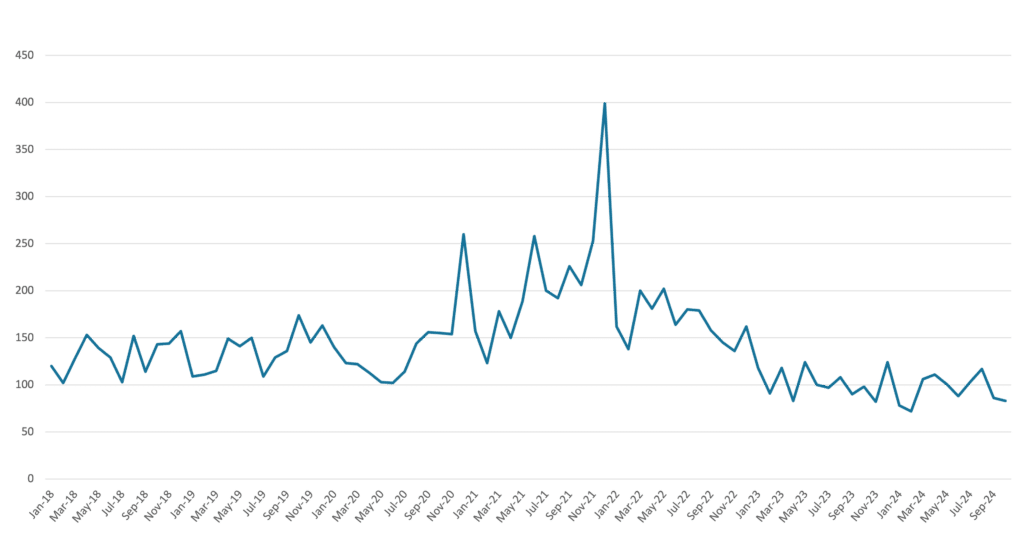
* Source: CoStar
Under Construction NRSF as a % of Existing Inventory
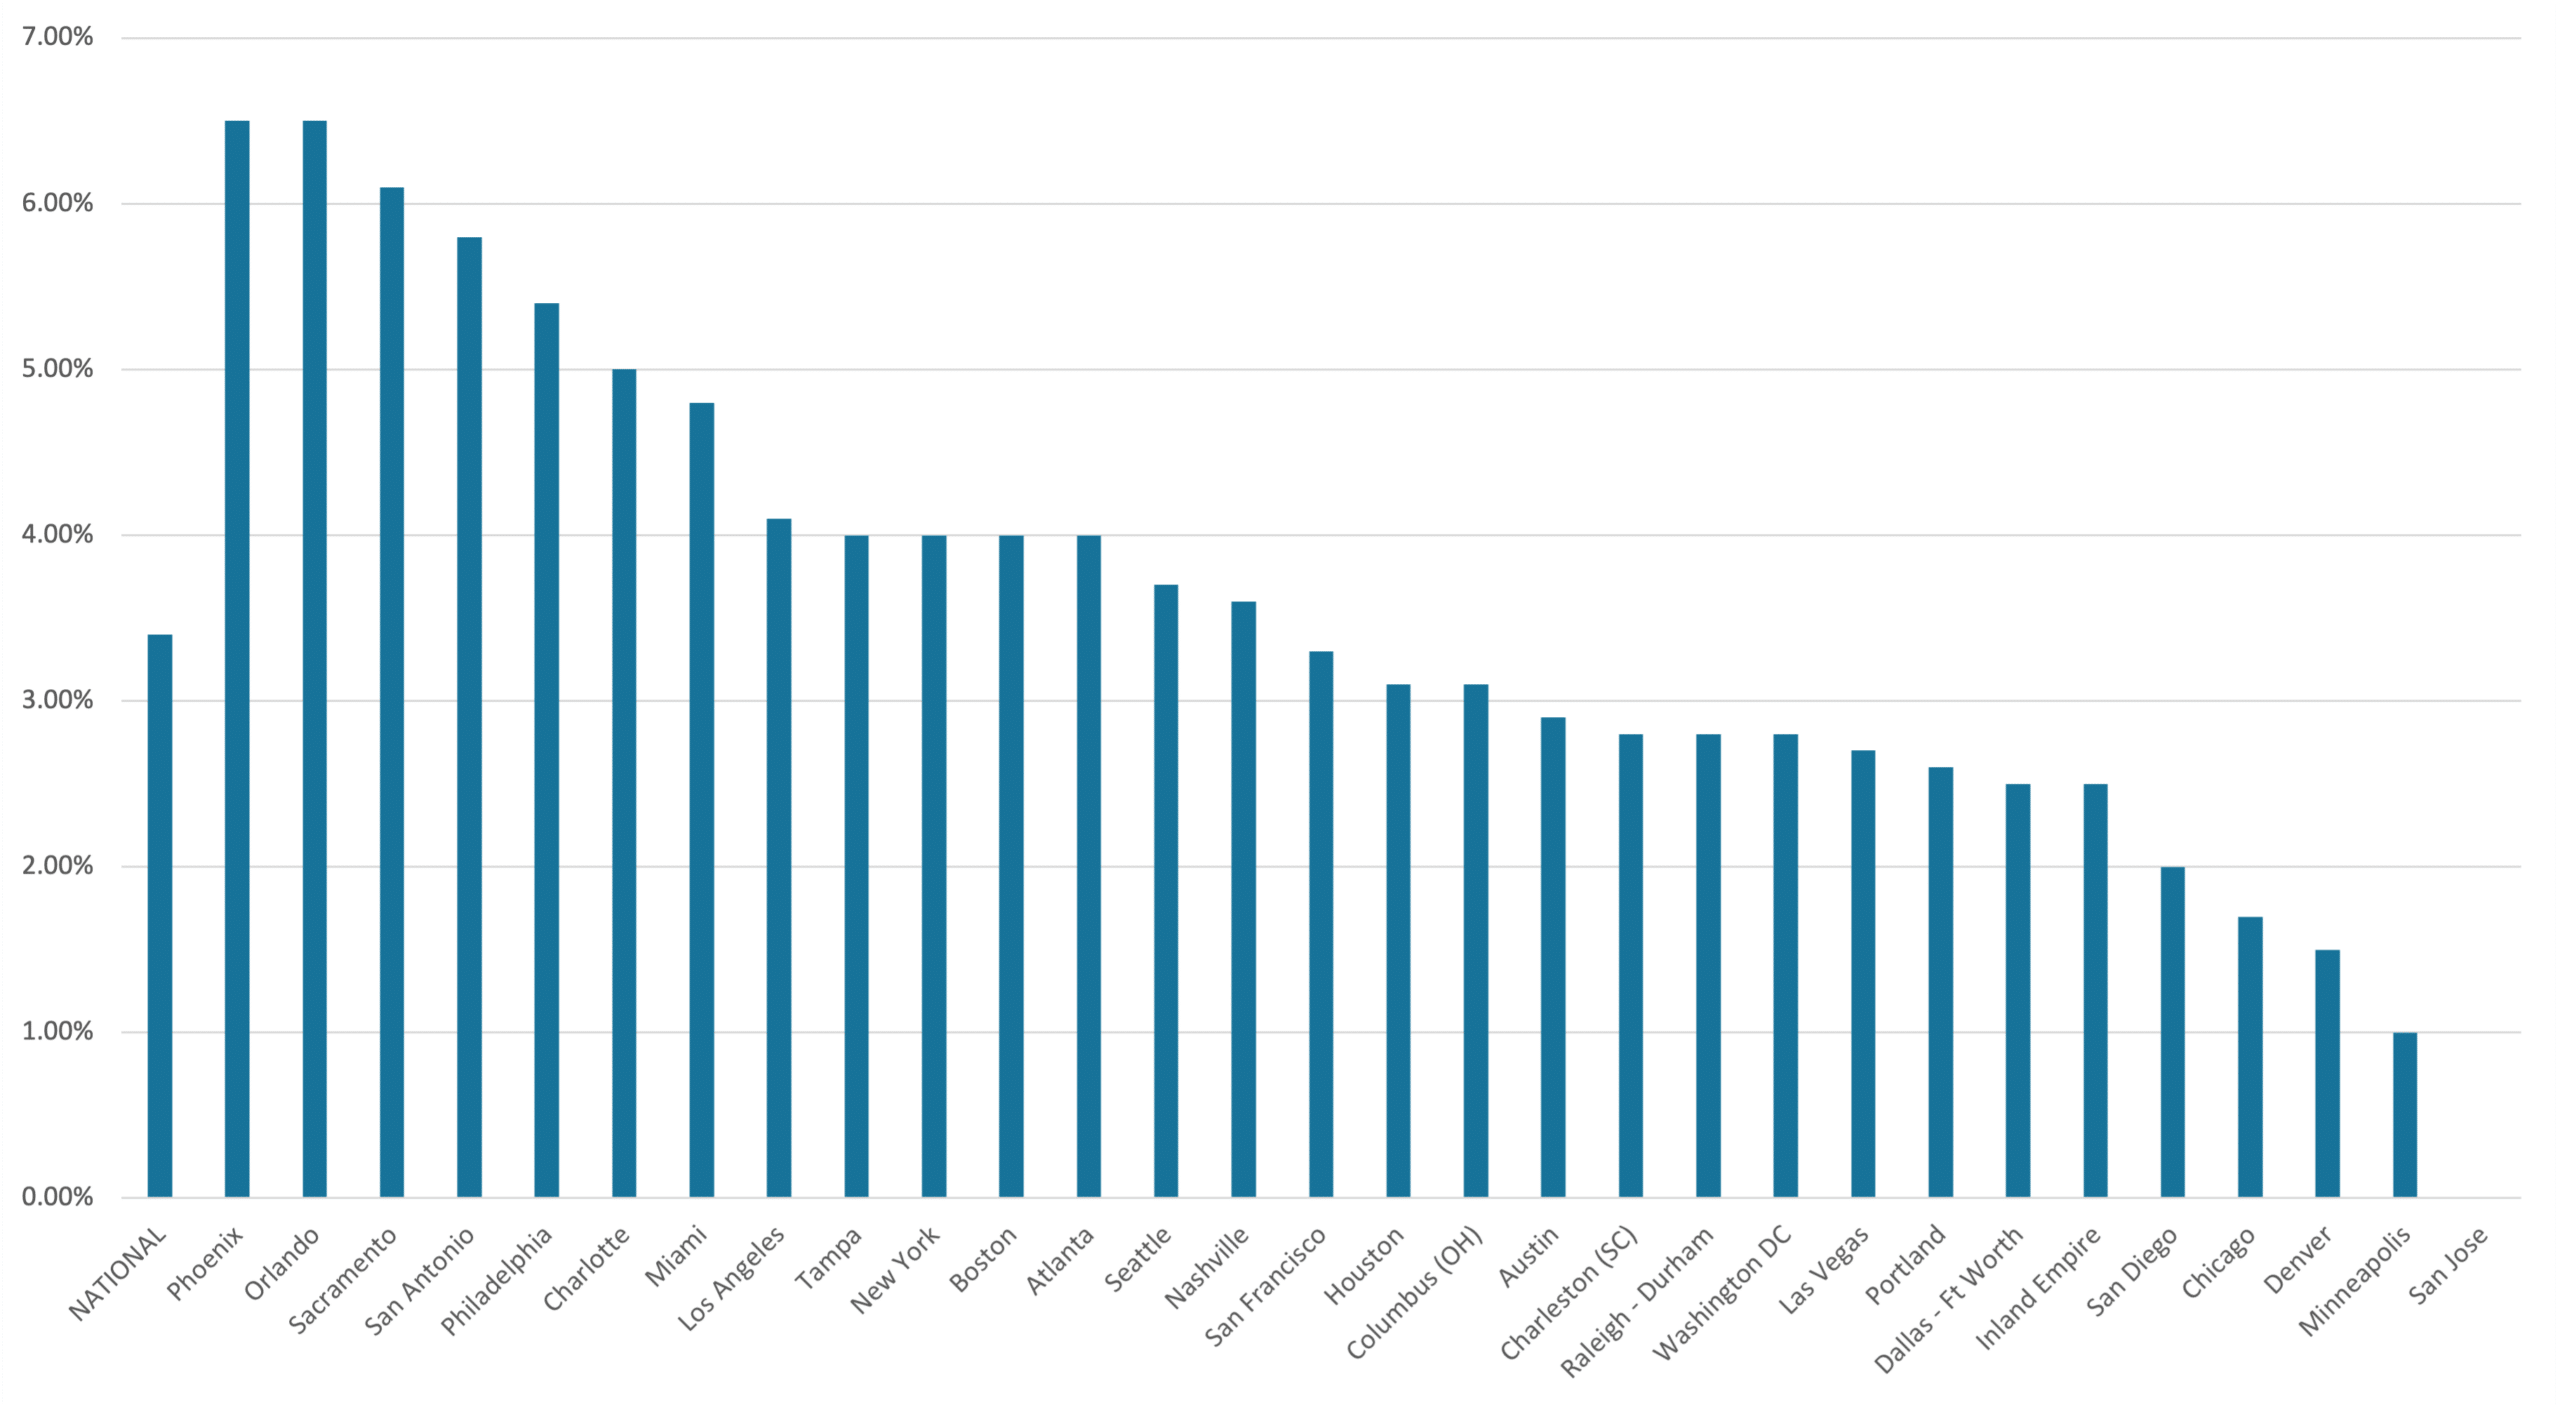
* Source: Yardi Matrix
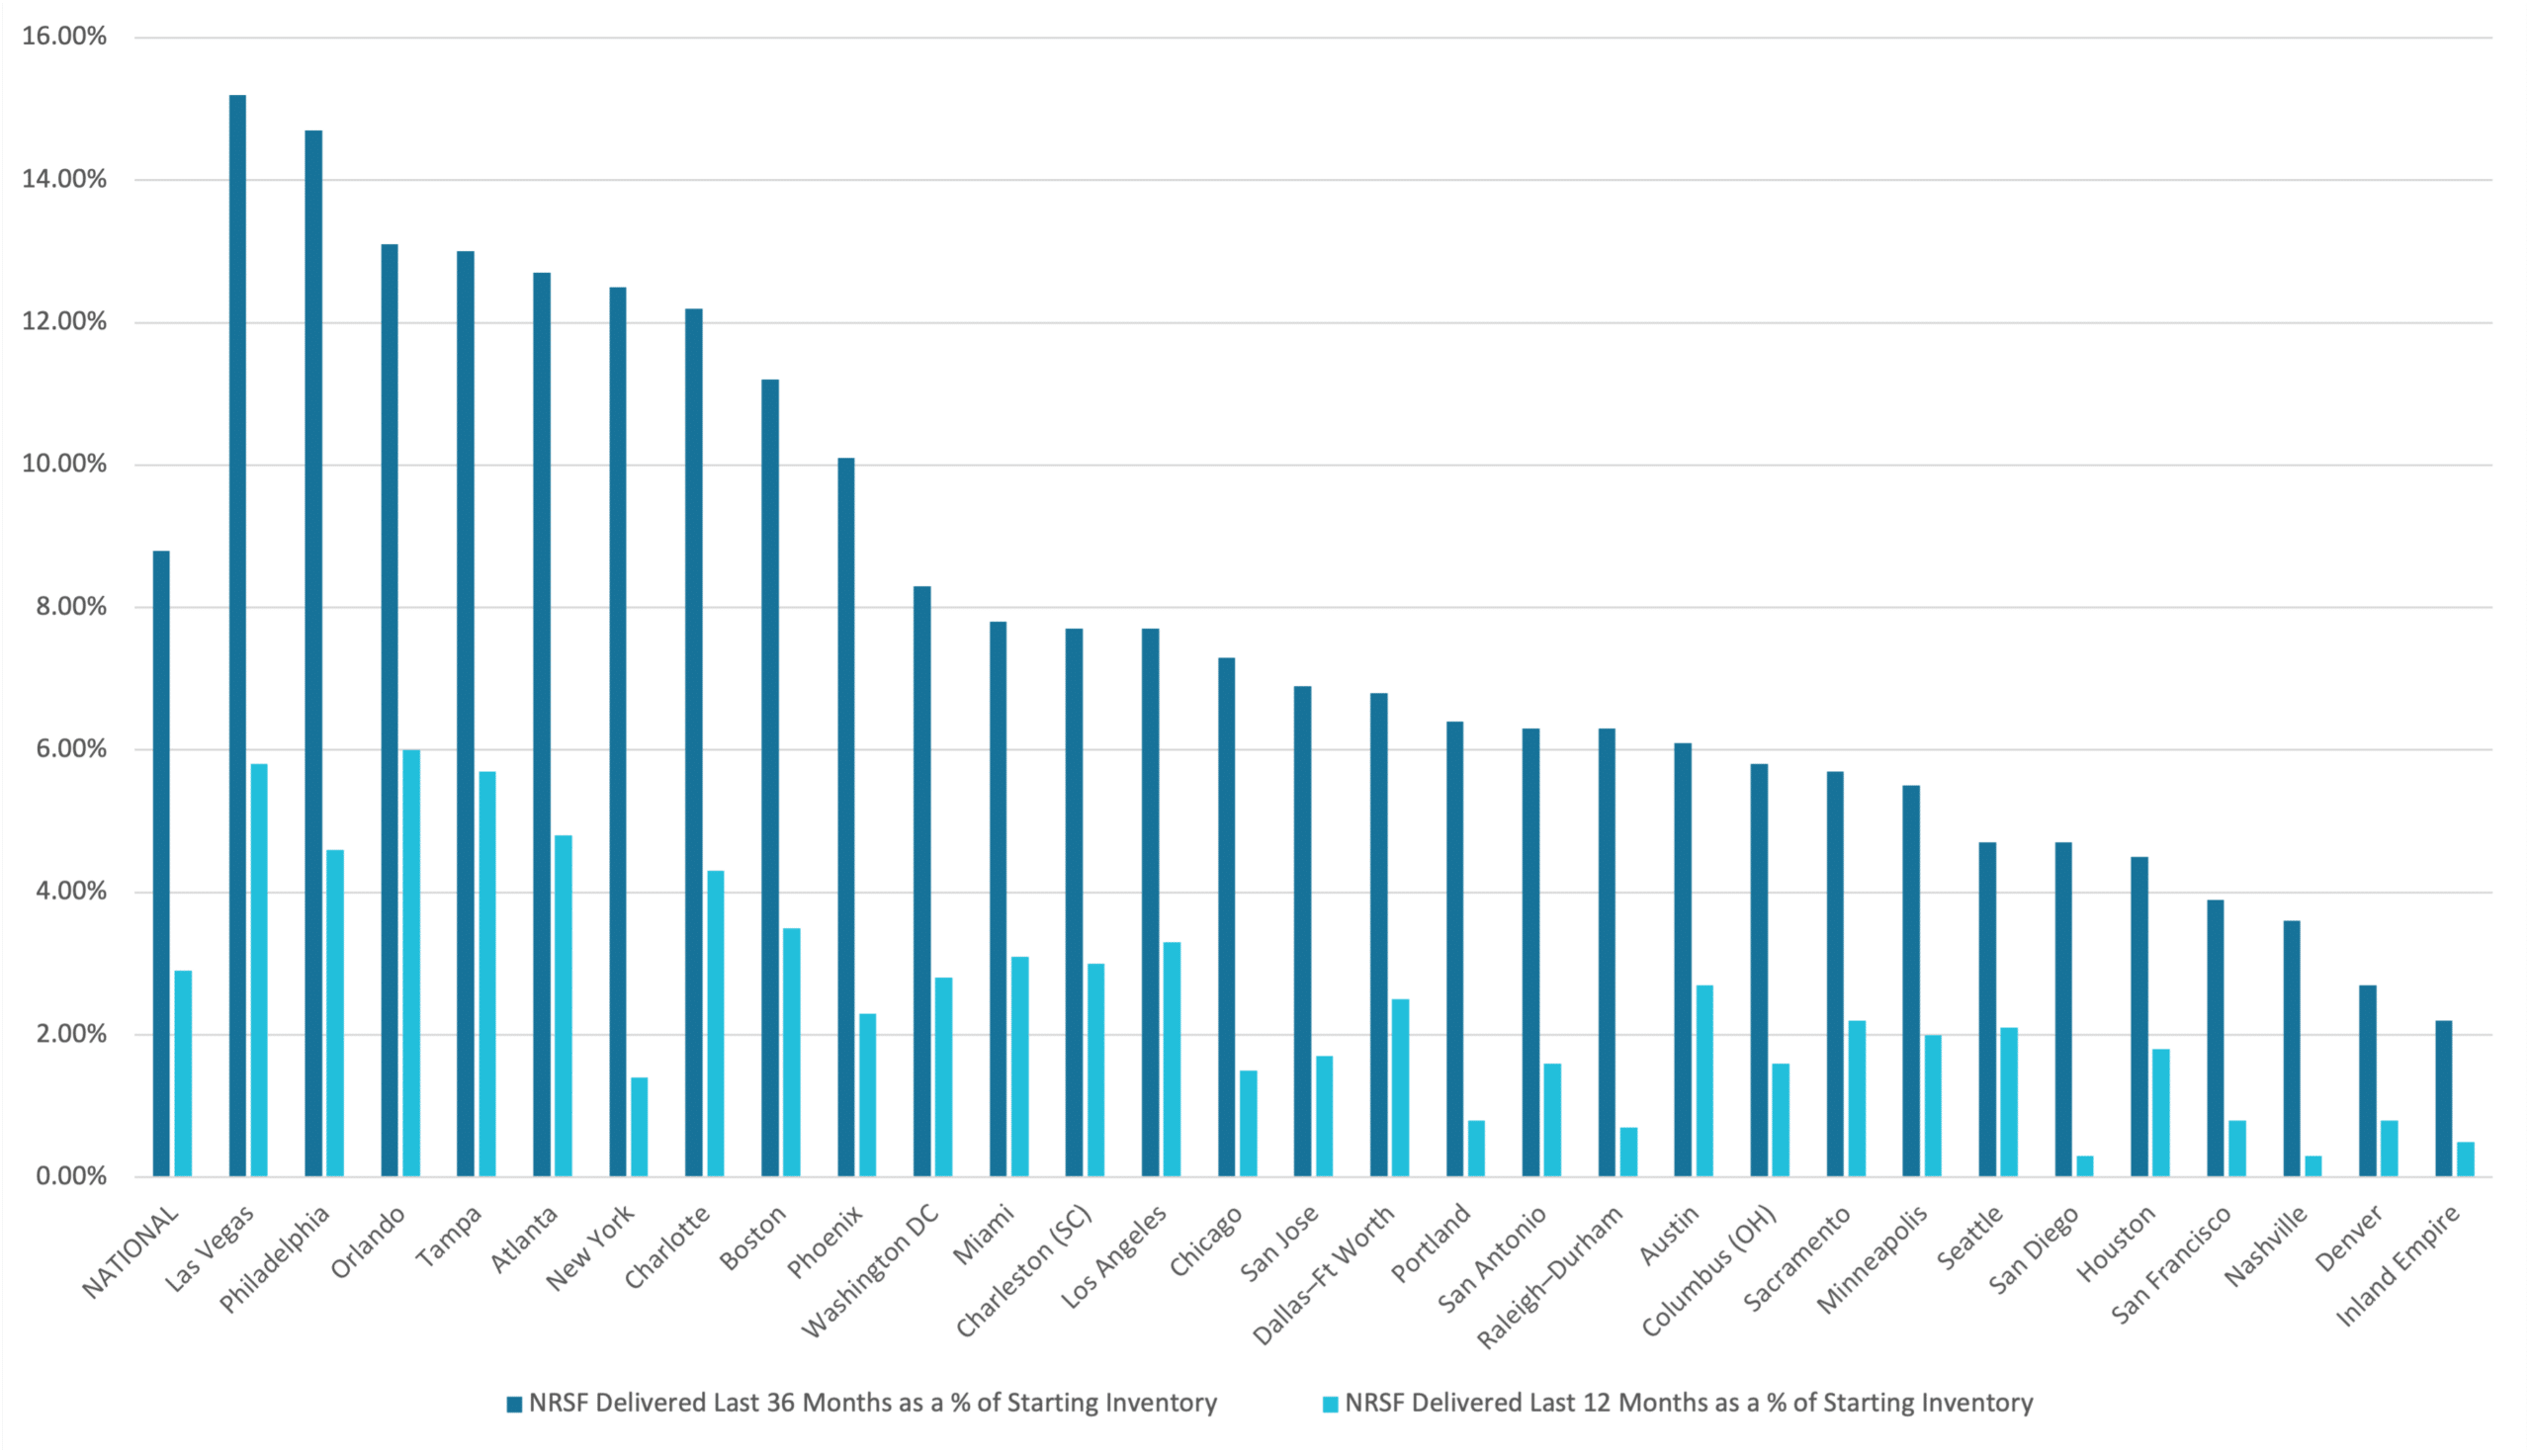
NRSF Delivered as a % of Starting Inventory
* Source: Yardi Matrix
Self-Storage Cap Rates & Bid-Ask Spread
The self-storage REIT sector has witnessed cap rate adjustments as interest rates rise, with cap rates generally stabilizing around 5-6% for new acquisitions. Extra Space reported achieving cap rates in the low 5% range on wholly owned deals, with stabilized yields at 6.5%, leveraging off-market acquisitions for favorable bid-ask spreads. Public Storage reported similar cap rates of around 6%, with an anticipated shift to stabilized yields of 6%+ in line with return requirements. National Storage Affiliates’ acquisitions also reflect these trends, with stabilized yields at 6% in high-competition markets such as Texas and Oklahoma. The current market environment, with limited financing options and high construction costs, has pushed cap rates higher than pre-2022 levels, making acquisitions more attractive and achievable for REITs, provided they meet target yields and favorable bid-ask spreads.
Implied Cap Rate History
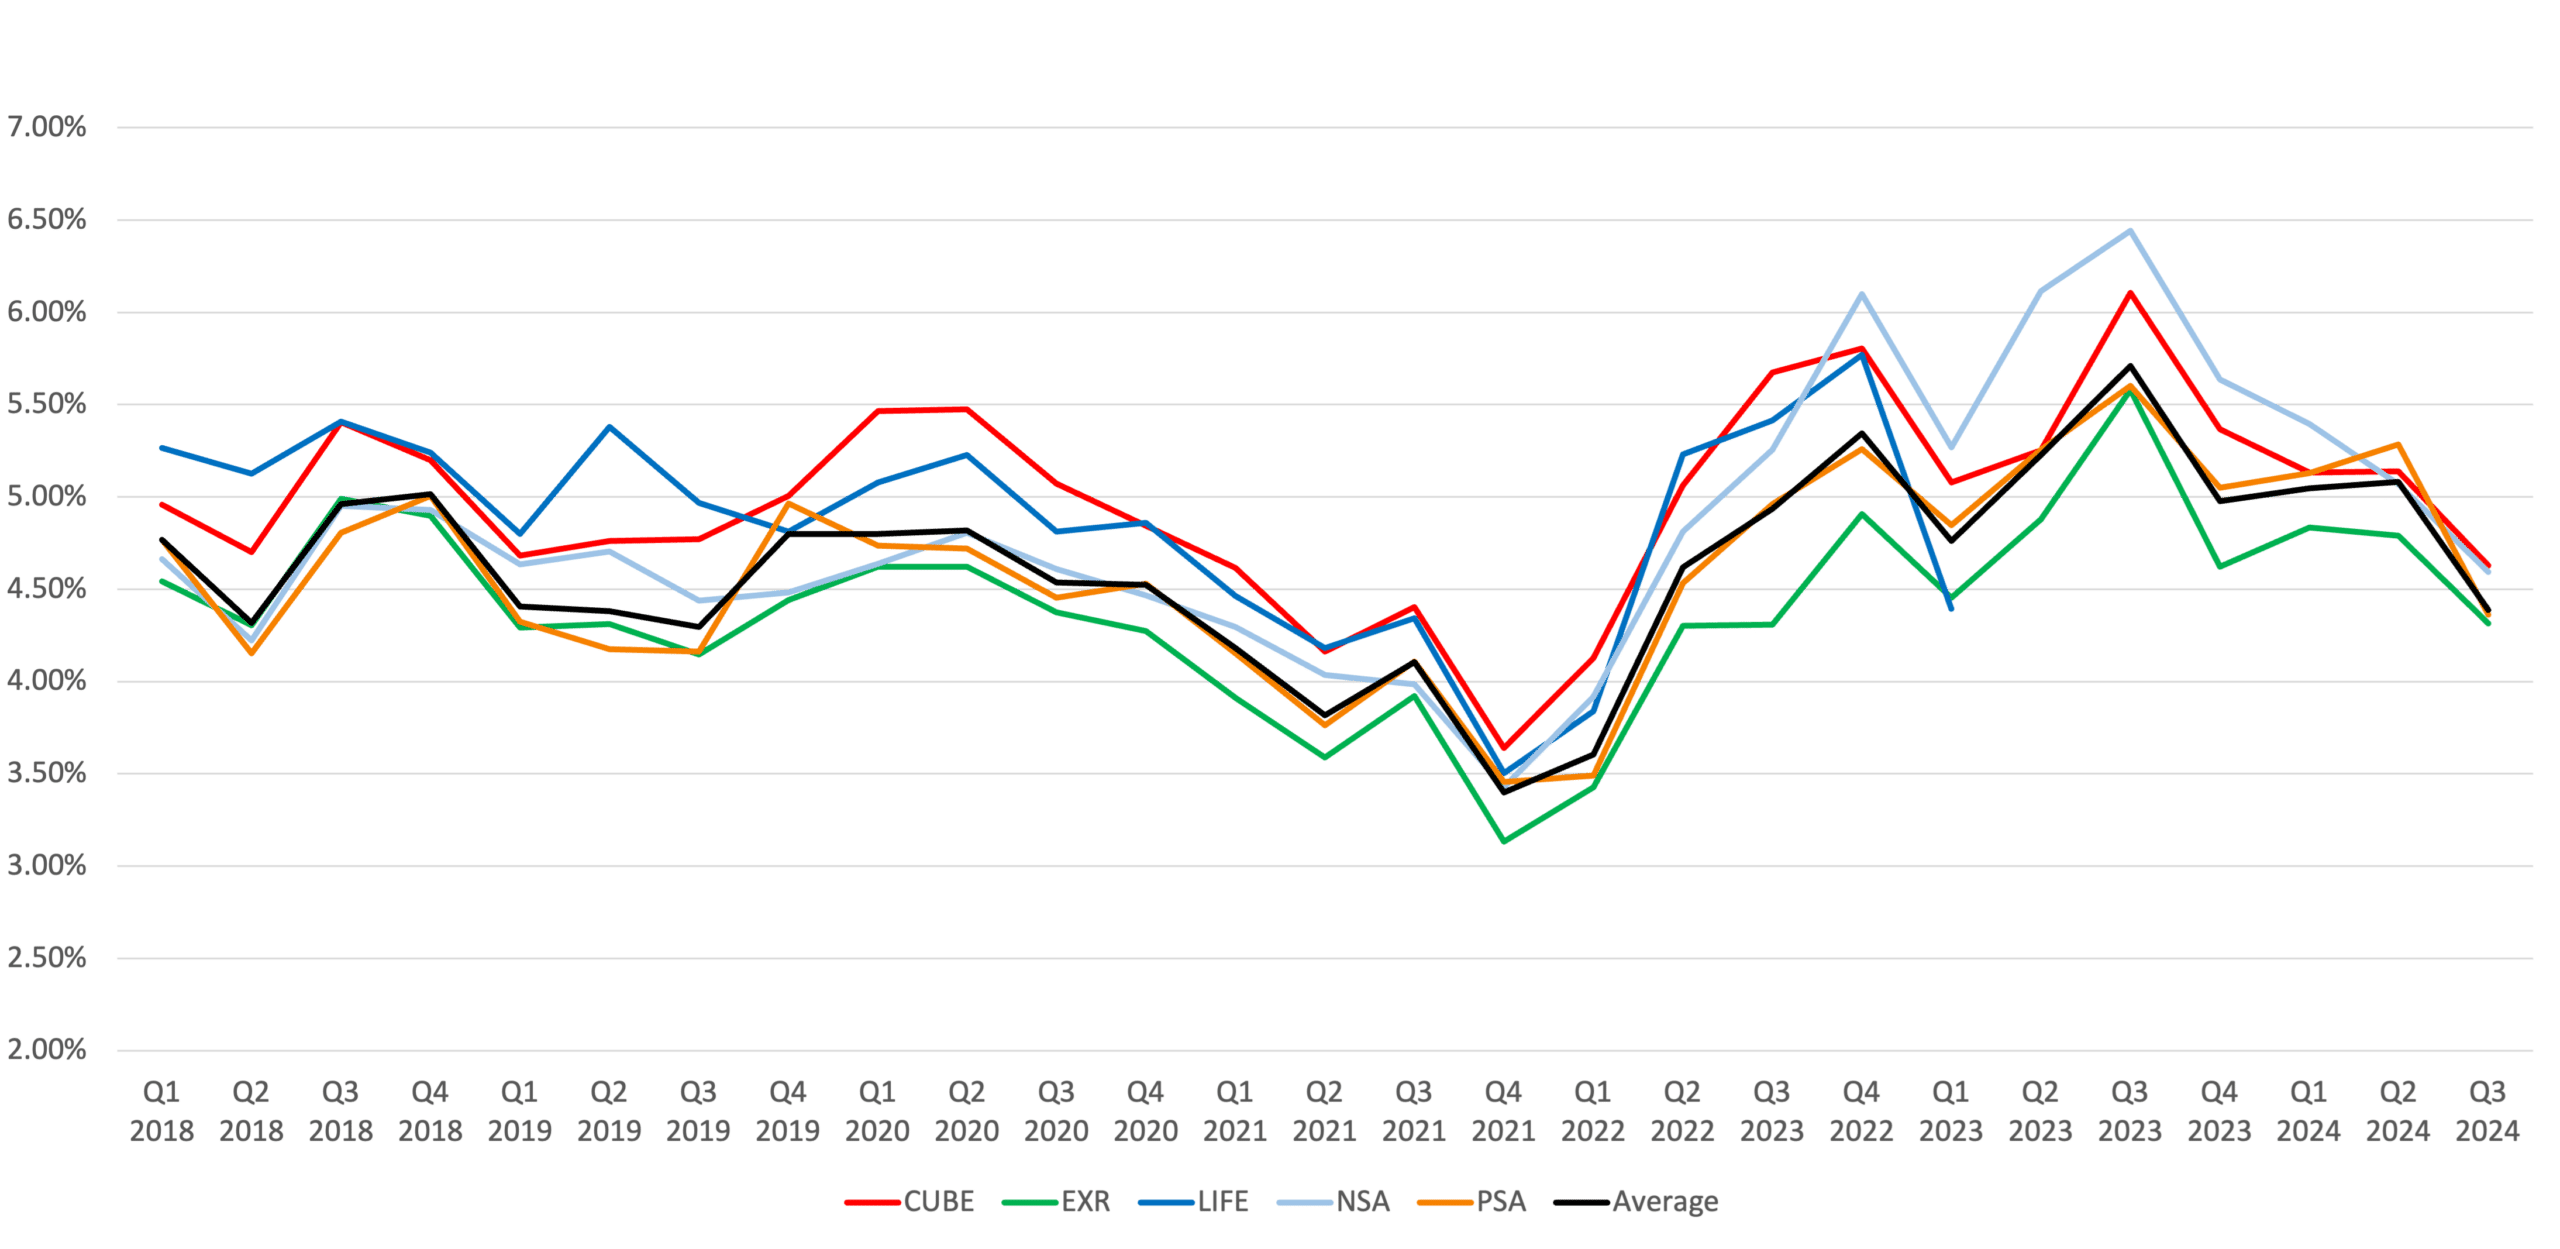
*The implied cap rate data indicates the market value of each REIT.
The implied capitalization rate is a culmination of the company value and total debt of each company divided by its NOI.
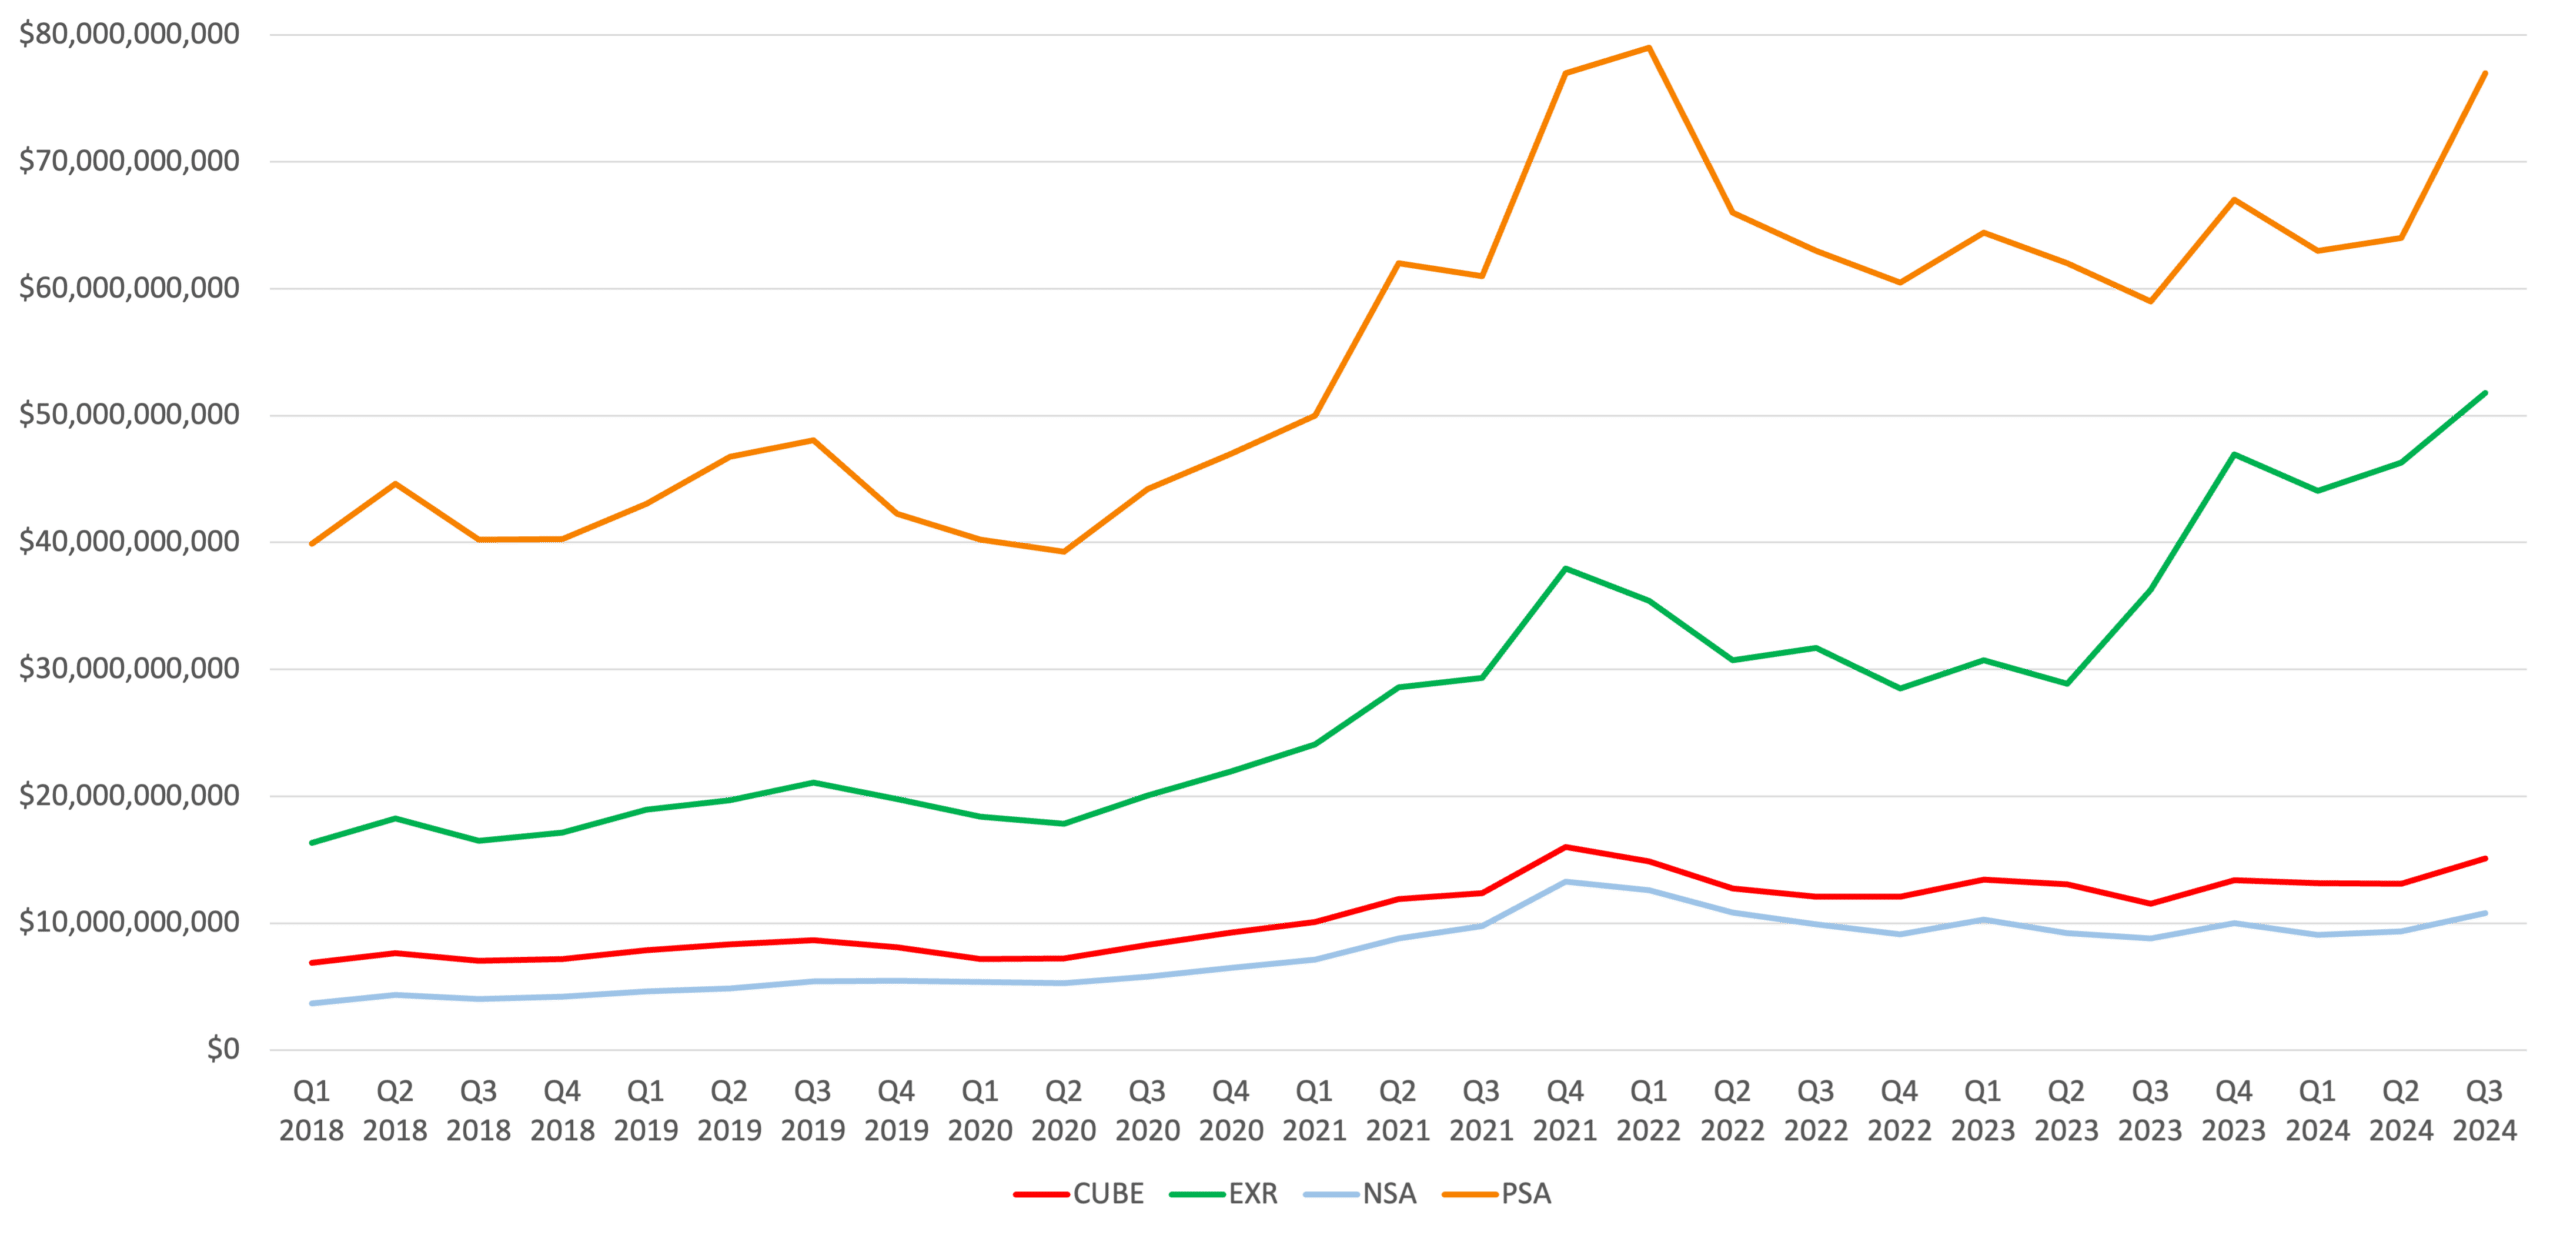
Enterprise Value History
Headwinds in the Self-Storage Market
Despite favorable conditions, self-storage REITs face challenges, including increased competition in certain markets, rising operating costs, and pressures on rental rates. Sunbelt markets, such as Florida and Arizona, are experiencing elevated supply, which has pressured occupancy and rents. National Storage Affiliates reported similar headwinds in competitive Sunbelt markets. Rising interest rates are another challenge, as they have increased the cost of borrowing for acquisitions and development, slowing new project feasibility. Public Storage and Extra Space both cited high construction and labor costs as factors limiting new developments, which has led REITs to focus on optimizing existing properties rather than expanding aggressively. Additionally, the housing market slowdown, marked by lower mobility due to high mortgage rates, has impacted demand for storage in some regions, as fewer people move and need temporary storage solutions. REITs are thus focused on adjusting pricing, managing expenses, and targeting growth opportunities that mitigate these headwinds while retaining operational stability.
Tailwinds in the Self-Storage Market
Several macroeconomic and demographic trends continue to support demand in the self-storage market, especially as urban populations seek flexible storage solutions. Public Storage noted increased digital adoption, with 75% of move-ins now processed through eRental, and reported over 2 million users on the Public Storage app, indicating customer preference for digital engagement. CubeSmart experienced strong urban demand in markets like New York City, with its borough portfolio recording a 7.4% increase in rentals year-over-year, driven by limited residential space and high rental demand. Extra Space highlighted a return to pre-pandemic demand levels, with high customer retention and reduced seasonal move-outs. Additionally, limited new construction in many areas, owing to rising labor and material costs, has tempered supply growth, creating favorable conditions for REITs to maintain occupancy and rental rates. This combination of digital integration, urban demand, and limited new supply provides a strong foundation for the self-storage sector’s growth.
Q3 2024 Self-Storage REIT Data by MSA
| Average Occupancy Same Store | Achieved Rate Same Store | |||||||||||
| CUBE | EXR | NSA | PSA | Average | CUBE | EXR | NSA | PSA | Average | |||
| Atlanta, GA | 89.30% | 93.80% | 83.50% | 89.10% | 88.93% | Atlanta, GA | $16.79 | $17.71 | $13.40 | $17.06 | $16.24 | |
| Austin, TX | 88.60% | 94.30% | 84.90% | - | 89.27% | Austin, TX | $18.70 | $18.07 | $17.04 | - | $17.94 | |
| Baltimore, MD | 91.30% | - | - | 93.30% | 92.30% | Baltimore, MD | $23.38 | - | - | $23.32 | $23.35 | |
| Boston, MA | 90.40% | 95.70% | - | - | 93.05% | Boston, MA | $26.91 | $28.48 | - | - | $27.70 | |
| Bridgeport, CT | 89.40% | - | - | - | 89.40% | Bridgeport, CT | $30.29 | - | - | - | $30.29 | |
| Brownsville, TX | - | - | 89.00% | - | 89.00% | Brownsville, TX | - | - | $13.10 | - | $13.10 | |
| Charleston, SC | 89.90% | 96.00% | - | - | 92.95% | Charleston, SC | $16.72 | $18.12 | - | - | $17.42 | |
| Charlotte, NC | 90.70% | - | - | 91.80% | 91.25% | Charlotte, NC | $18.48 | - | - | $16.00 | $17.24 | |
| Chicago, IL | 92.70% | 94.50% | - | 93.60% | 93.60% | Chicago, IL | $19.60 | $20.65 | - | $20.66 | $20.30 | |
| Cincinnati, OH | - | 94.20% | - | - | 94.20% | Cincinnati, OH | - | $13.79 | - | - | $13.79 | |
| Cleveland, OH | 88.60% | - | - | - | 88.60% | Cleveland, OH | $17.08 | - | - | - | $17.08 | |
| Colorado Springs, CO | - | - | 87.70% | - | 87.70% | Colorado Springs, CO | - | - | $13.62 | - | $13.62 | |
| Columbus, OH | 90.20% | 93.20% | - | - | 91.70% | Columbus, OH | $14.14 | $12.67 | - | - | $13.41 | |
| Dallas, TX | 91.10% | 94.60% | 83.00% | 89.40% | 89.53% | Dallas, TX | $18.76 | $18.27 | $14.17 | $18.32 | $17.38 | |
| DC | 90.90% | 95.60% | - | 93.70% | 93.40% | DC | $27.27 | $24.45 | - | $27.10 | $26.27 | |
| Denver, CO | 91.70% | 94.50% | - | - | 93.10% | Denver, CO | $18.99 | $19.24 | - | - | $19.12 | |
| Ft Myers, FL | 87.60% | - | - | - | 87.60% | Ft Myers, FL | $20.88 | - | - | - | $20.88 | |
| Hawaii, HI | - | 92.90% | - | - | 92.90% | Hawaii, HI | - | $46.42 | - | - | $46.42 | |
| Hartford, CT | 89.80% | - | - | - | 89.80% | Hartford, CT | $18.08 | - | - | - | $18.08 | |
| Houston, TX | 92.60% | 95.00% | 89.00% | 92.60% | 92.30% | Houston, TX | $17.74 | $17.13 | $12.96 | $16.94 | $16.19 | |
| Indianapolis. IN | - | 91.00% | - | - | 91.00% | Indianapolis. IN | - | $12.29 | - | - | $12.29 | |
| Jacksonville, FL | 91.20% | - | - | - | 91.20% | Jacksonville, FL | $21.05 | - | - | - | $21.05 | |
| Las Vegas, NV | 91.50% | 94.30% | 86.30% | - | 90.70% | Las Vegas, NV | $19.16 | $17.38 | $14.64 | - | $17.06 | |
| Los Angeles, CA | 91.00% | 94.60% | 87.10% | 94.10% | 91.70% | Los Angeles, CA | $28.88 | $30.25 | $24.92 | $36.51 | $30.14 | |
| Louisville, KY | - | 90.60% | - | - | 90.60% | Louisville, KY | - | $11.96 | - | - | $11.96 | |
| Memphis, TN | - | 93.50% | - | - | 93.50% | Memphis, TN | - | $12.05 | - | - | $12.05 | |
| McAllen, TX | - | - | 90.00% | - | 90.00% | McAllen, TX | - | - | $13.43 | - | $13.43 | |
| Miami, FL | 92.30% | 94.00% | - | 92.80% | 93.03% | Miami, FL | $25.78 | $27.93 | - | $30.19 | $27.97 | |
| Nashville, TN | 89.60% | - | - | - | 89.60% | Nashville, TN | $17.03 | - | - | - | $17.03 | |
| New Orleans, LA | - | - | 81.40% | - | 81.40% | New Orleans, LA | - | - | $15.00 | - | $15.00 | |
| New York | 91.70% | 94.60% | - | 93.80% | 93.37% | New York | $37.44 | $29.93 | - | $32.48 | $33.28 | |
| Norfolk, VA | - | 95.70% | - | - | 95.70% | Norfolk, VA | - | $18.17 | - | - | $18.17 | |
| OKC, OK | - | - | 87.20% | - | 87.20% | OKC, OK | - | - | $11.05 | - | $11.05 | |
| Orlando, FL | 91.70% | 94.70% | - | 92.20% | 92.87% | Orlando, FL | $17.11 | $17.27 | - | $18.77 | $17.72 | |
| Philadelphia, PA | 91.20% | 94.10% | - | 93.20% | 92.83% | Philadelphia, PA | $21.34 | $20.54 | - | $20.95 | $20.94 | |
| Phoenix, AZ | 89.70% | 94.00% | 83.00% | - | 88.90% | Phoenix, AZ | $17.32 | $17.48 | $16.11 | - | $16.97 | |
| Portland. OR | - | 96.00% | 89.60% | - | 92.80% | Portland. OR | - | $20.04 | $18.81 | - | $19.43 | |
| Providence, RI | 91.30% | - | - | - | 91.30% | Providence, RI | $20.24 | - | - | - | $20.24 | |
| Richmond, VA | - | 96.50% | - | - | 96.50% | Richmond, VA | - | $18.57 | - | - | $18.57 | |
| Riverside, CA | 88.50% | - | 87.20% | - | 87.85% | Riverside, CA | $19.92 | - | $16.25 | - | $18.09 | |
| Sacramento, CA | 89.50% | 95.40% | - | - | 92.45% | Sacramento, CA | $18.18 | $20.68 | - | - | $19.43 | |
| San Antonio, TX | 90.10% | - | 83.80% | - | 86.95% | San Antonio, TX | $16.67 | - | $15.34 | - | $16.01 | |
| San Diego, CA | 90.40% | - | - | - | 90.40% | San Diego, CA | $27.23 | - | - | - | $27.23 | |
| San Fransisco, CA | - | 95.00% | - | 94.10% | 94.55% | San Fransisco, CA | - | $35.65 | - | $33.20 | $34.43 | |
| Sarasota, FL | - | - | 85.60% | - | 85.60% | Sarasota, FL | - | - | $20.34 | - | $20.34 | |
| Seattle, WA | - | - | - | 93.20% | 93.20% | Seattle, WA | - | - | - | $25.93 | $25.93 | |
| Tampa, FL | 91.30% | 94.80% | - | - | 93.05% | Tampa, FL | $20.89 | $19.97 | - | - | $20.43 | |
| Toucson, AZ | 87.40% | - | - | - | 87.40% | Toucson, AZ | $17.53 | - | - | - | $17.53 | |
| Tulsa, OK | - | - | 86.30% | - | 86.30% | Tulsa, OK | - | - | $11.17 | - | $11.17 | |
| West Palm Beach, FL | - | - | - | 91.90% | 91.90% | West Palm Beach, FL | - | - | - | $26.22 | $26.22 | |
| Other | 89.40% | 94.50% | 85.80% | 92.70% | 90.60% | Other | $19.34 | $17.86 | $15.29 | $18.45 | $17.74 | |
| Total | 90.80% | 94.40% | 86.30% | 92.70% | 91.05% | Total | $23.05 | $21.84 | $15.67 | $22.71 | $20.82 | |
Contributors
Steven Paul
Senior Financial Analyst
Aaron Sanchez
Managing Director
Scott Schoettlin
Managing Director
