Q4 Manufactured Housing REIT Highlights
- Rental Rates and Home Values: ELS reported 5.8% year-over-year rent growth across its manufactured housing portfolio in Q4 2024. Average home prices in its communities remained approximately $80,000, highlighting manufactured housing’s affordability advantage compared to traditional site-built homes.
- Occupancy: Manufactured housing occupancy for ELS was highlighted in key markets, with the California portfolio being more than 98% occupied. There are opportunities to increase occupancy above 95% in Florida and Arizona, supported by stable long-term residents and strong demand for age-restricted and resort-style communities in Sunbelt markets.
- Income and Expense Information: Same-property NOI grew 7.6% year-over-year in Q4 2024, reflecting strong rental growth. Full-year property operating expenses increased by 2.6% compared to 2023.
- Rental Rates and Home Values: Sun achieved a 5.5% increase in weighted average monthly rent across its manufactured housing portfolio, contributing to a 6.8% increase in same-property MH revenues.
- Occupancy: Occupancy for Sun’s manufactured housing portfolio ended the year at 97.6%, supported by strong demand, particularly within age-restricted communities.
- Investment and Transaction Activity: Sun completed approximately $570 million in asset sales, including the $5.65 billion sale of its Safe Harbor Marinas platform, allowing the company to redeploy capital toward core manufactured housing and RV investments and reducing net debt-to-EBITDA to between 2.5x and 3x at closing.
- Rental Rates and Home Values: UMH achieved a 7.9% increase in same-property rental income for 2024 – additionally, UMH anticipates continuing to achieve 5% rent increases throughout the portfolio. As conventional home sales are currently a bit blocked, UMH expects more people to downsize and buy homes from them in cash, with higher-end homes priced between $250,000 and $300,000, and lot rents around $750 per month.
- Occupancy: UMH reported an increase in occupancy of 216 units, resulting in an increase of 70 basis points. Stabilized communities had occupancy closer to 94%. Infill efforts, including 190 expansion sites completed in 2024, contributed to occupancy growth, with a continued focus on converting vacant lots into revenue-producing rental sites.
- Income and Expense Information: UMH achieved 8% same-property NOI growth for the quarter, benefiting from higher rents and occupancy gains.
Thoughts from the CEO's
Equity Lifestyle Properties
Marguerite M. Nader
President, Chief Executive Officer & Director
- “The strength of ELS can be seen in all facets of our business. We continued our record of strong core operations and FFO growth with full year growth in NOI of 6.5% and a 5.9% increase in normalized FFO per share.”
Sun Communities
Gary A. Shiffman
Chairman, Chief Executive Officer, and President
- “We had a very productive 2024 as we advanced our strategic priorities with the primary goal of simplifying our operations, focusing on core assets and improving our balance sheet while positioning Sun for steady earnings growth.”
UMH Properties
Samuel A. Landy
President & Chief Executive
Officer
- “UMH is pleased to deliver another quarter and year of increased FFO per share, double digit community NOI growth and a new all-time high sales record. Normalized FFO for the quarter was $0.24 per share as compared to $0.23 per share last year, representing an increase of 4%.”
Macroeconomic Highlights
Interest Rates and Economic Slowdown: Economic uncertainty continues to weigh on the commercial real estate sector as the Federal Reserve’s higher-for-longer rate stance shapes capital markets and borrowing decisions. GDP growth slowed to an annualized rate of approximately 1.9% in Q4, down from stronger expansion earlier in the year, as elevated borrowing costs restricted consumer spending, home sales, and business investment. While inflation moderated to around 3%, the Fed emphasized that persistent cost pressures in services, insurance, and labor-intensive industries could delay rate cuts until the second half of 2025. For real estate, particularly sectors reliant on housing turnover or discretionary consumer spending, this environment limits pricing power and keeps transaction volume subdued until financing conditions ease.
Capital Markets and Post-Election Policy Shifts: Following the 2024 presidential election, attention has shifted to new fiscal priorities and their implications for commercial real estate investment. Early policy signals suggest a focus on healthcare spending reforms, renewed climate resilience programs, and potential adjustments to corporate tax rates, all of which will impact investor underwriting for assets. In addition, tightening global credit conditions and slower cross-border investment flows have reduced liquidity for larger transactions, reinforcing a flight to quality, where institutional investors prefer core assets in proven markets. For self-storage and medical office, this favors high-barrier, infill locations with strong demand drivers, while pricing uncertainty persists for secondary and tertiary markets where capital access remains constrained.
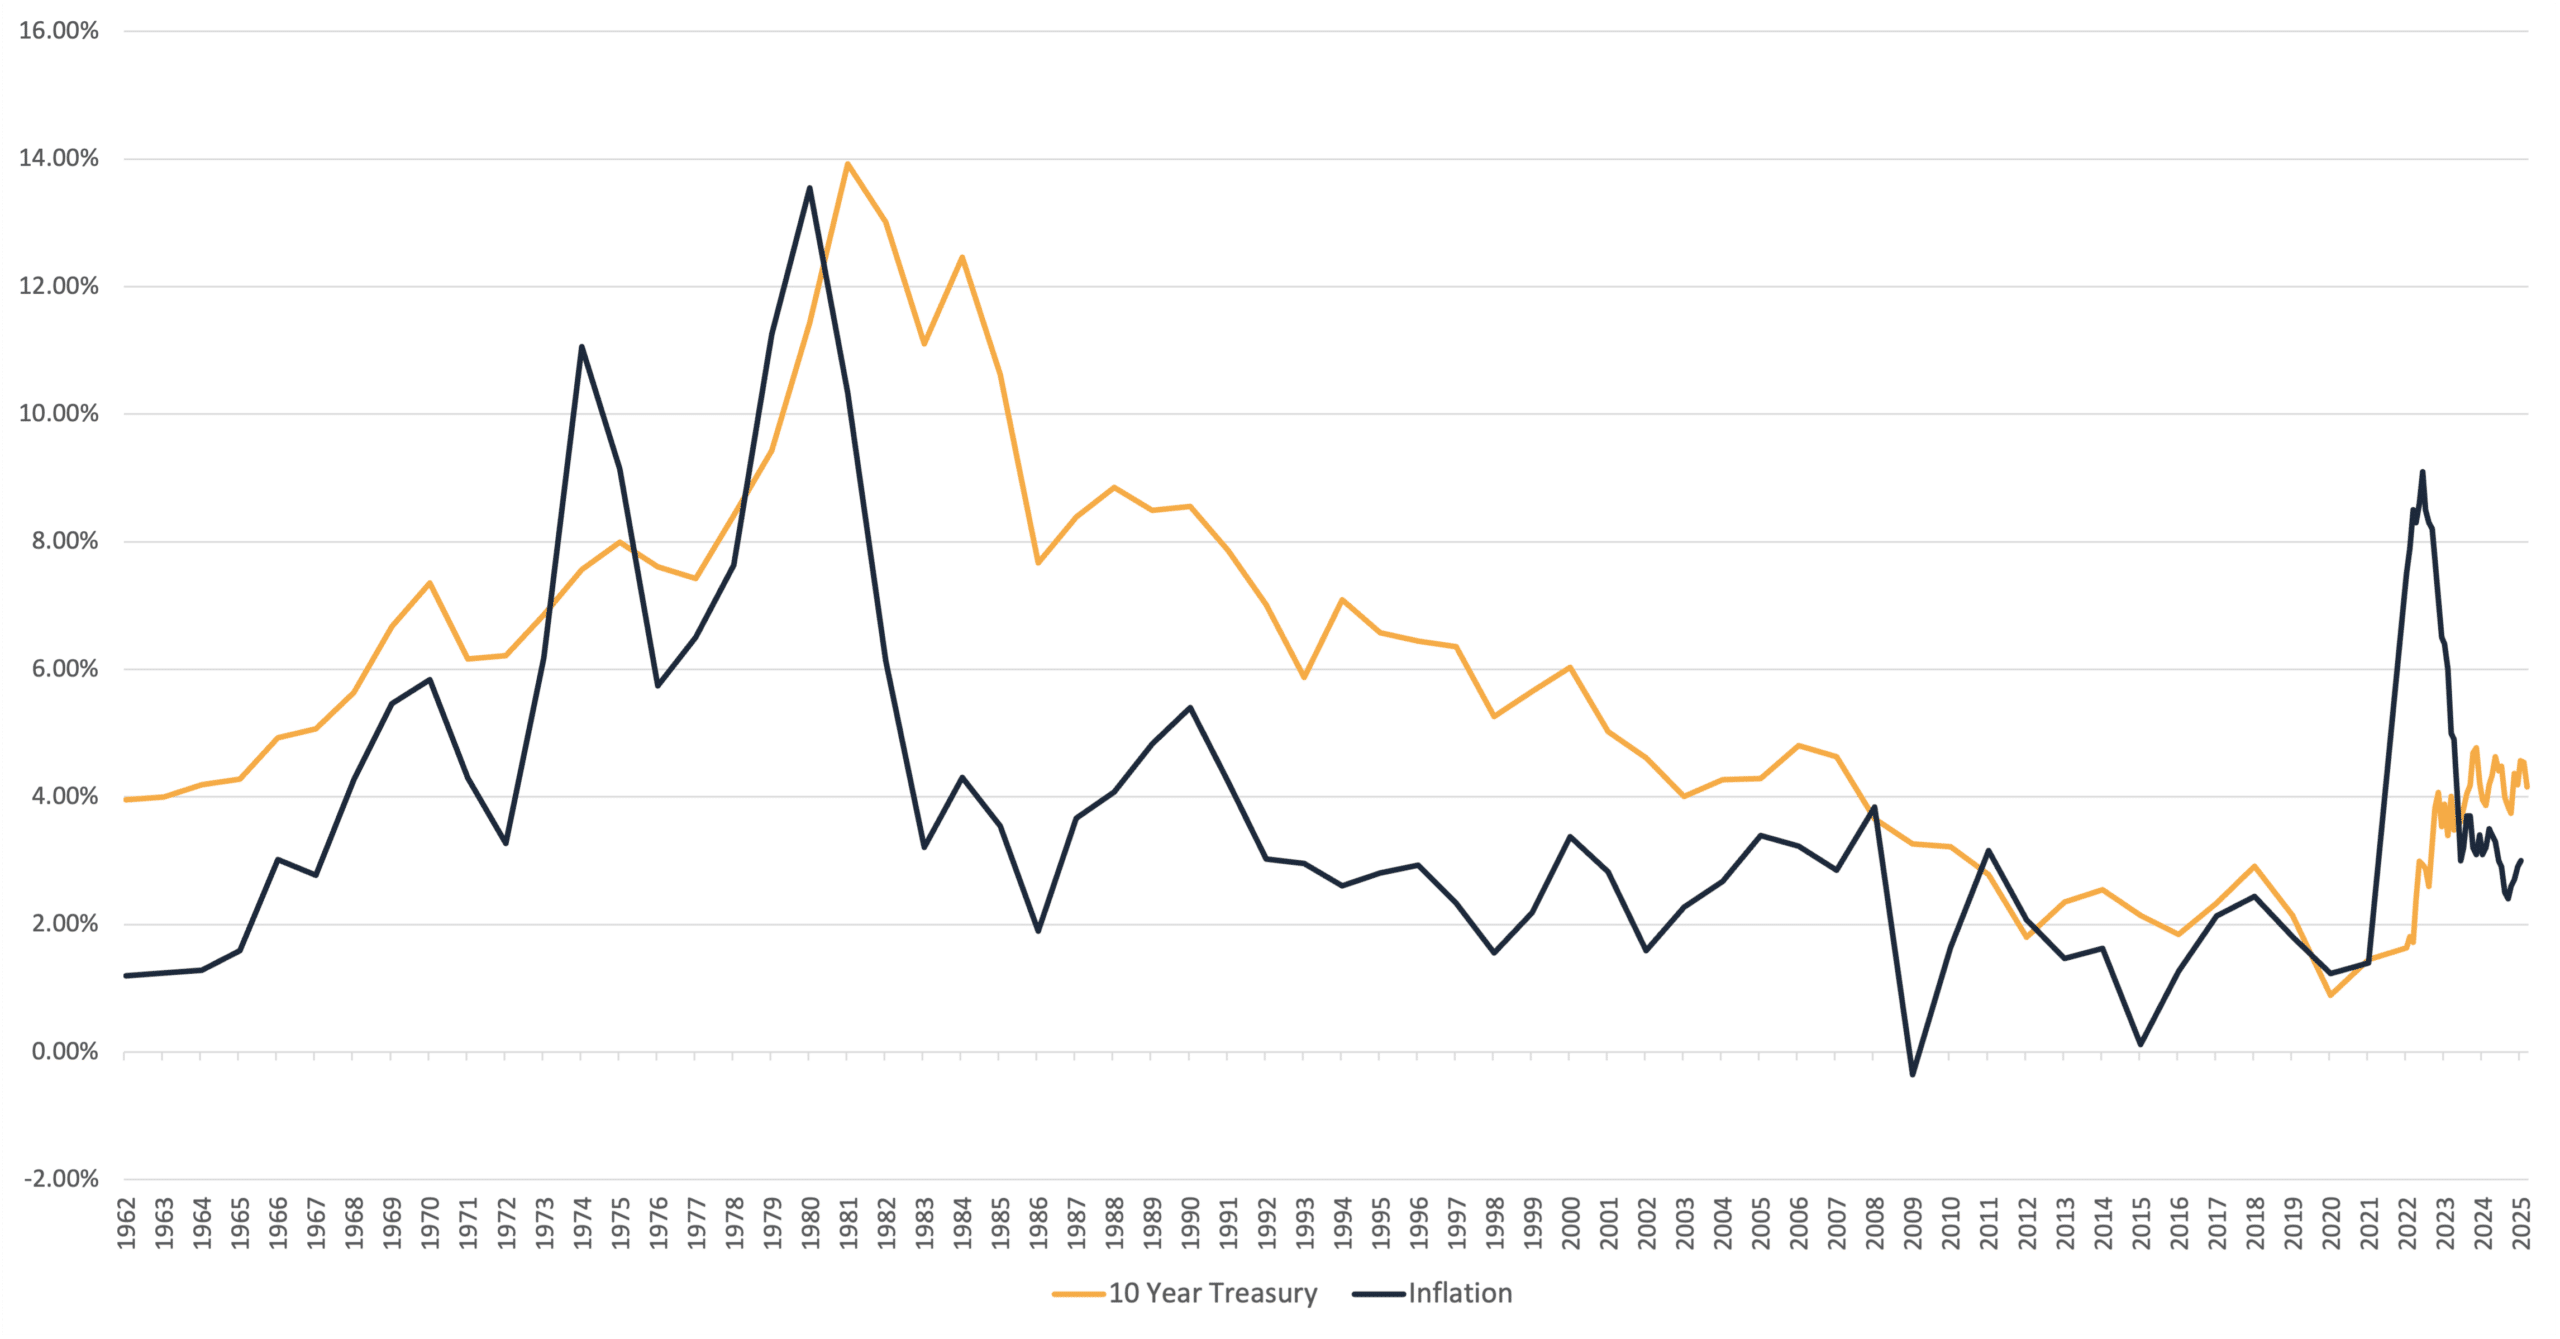
Inflation and the 10-Year Treasury Since 1962
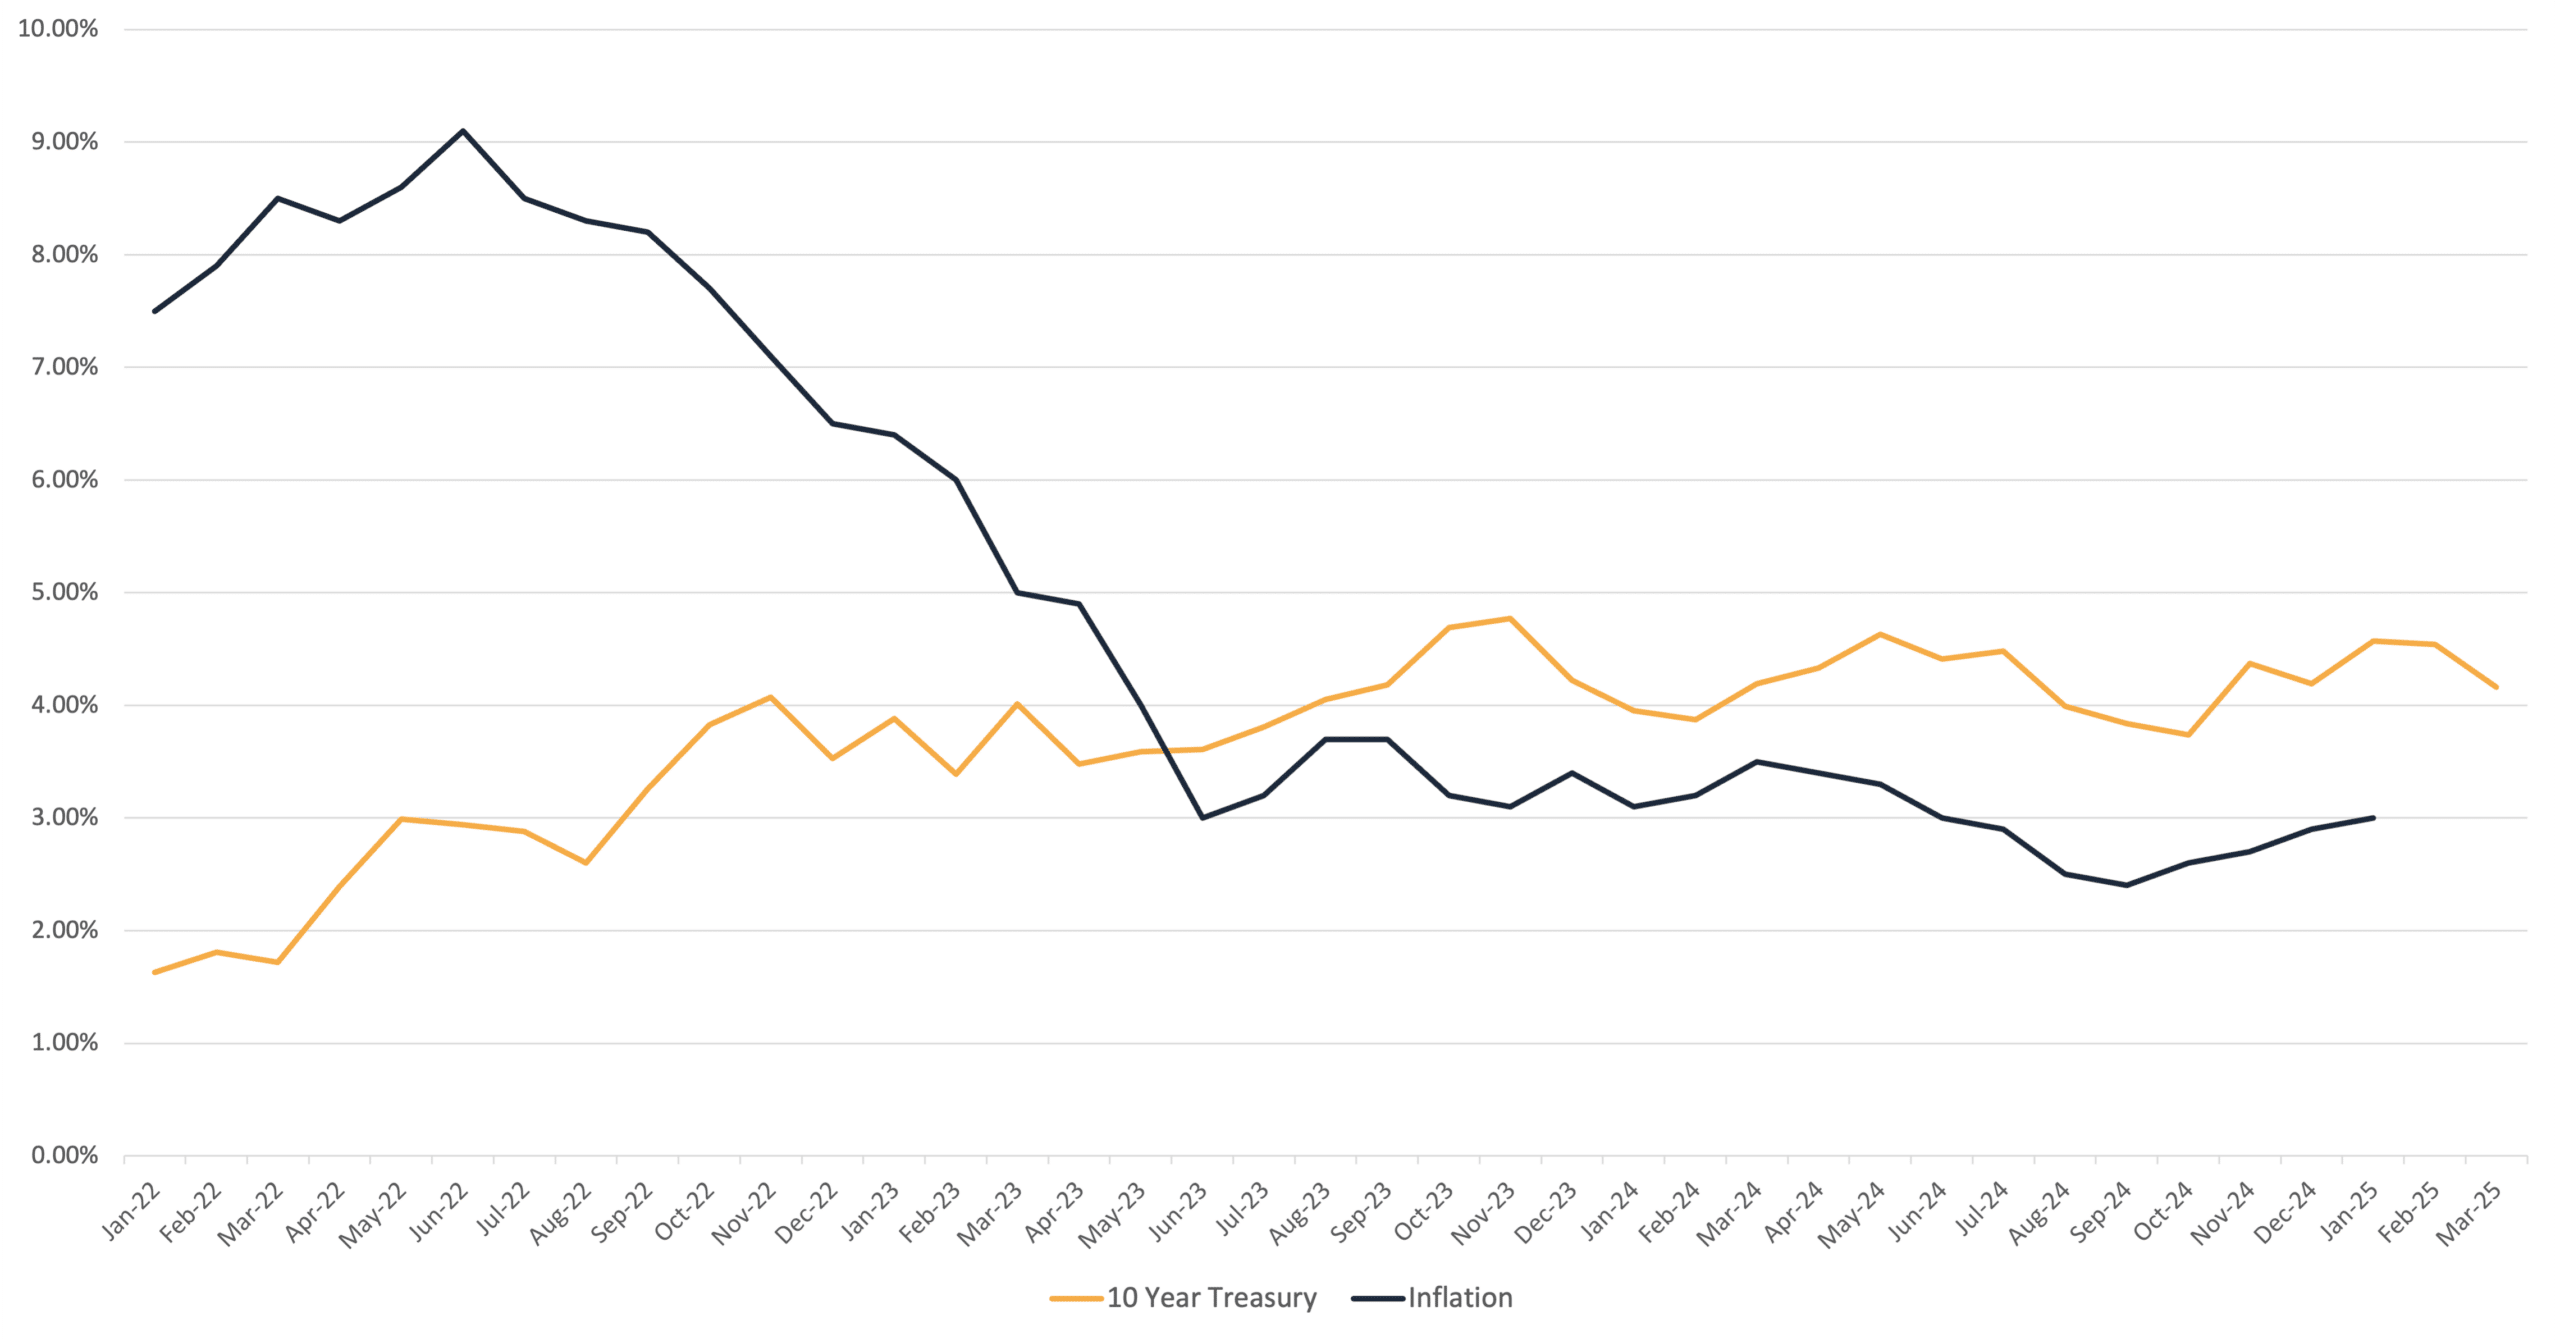
Inflation and the 10-Year Treasury Since 2022
Q4 2024 Manufactured Housing REIT Data Overview
| Equity Lifestyle Properties (ELS) | Sun Communities (SUI) | UMH Properties (UMH) | |||||
| Ending Occupancy (Same Store) | 2024 | 94.90% | 97.60% | 87.80% | |||
| 2023 | 94.90% | 97.30% | 88.50% | ||||
| YoY MH Rental Income Increase (Same Store) | 2024 | 5.8% | 6.7% | 7.9% | |||
| 2023 | 7.1% | 7.5% | 10.9% | ||||
| YoY MH Expense Increase (Same Store) | 2024 | 0.3% | 5.3% | 8.0% | |||
| 2023 | 8.7% | 4.8% | 0.2% | ||||
| YoY MH NOI Increase (Same Store) | 2024 | 7.6% | 7.1% | 7.8% | |||
| 2023 | 5.2% | 8.6% | 18.9% | ||||
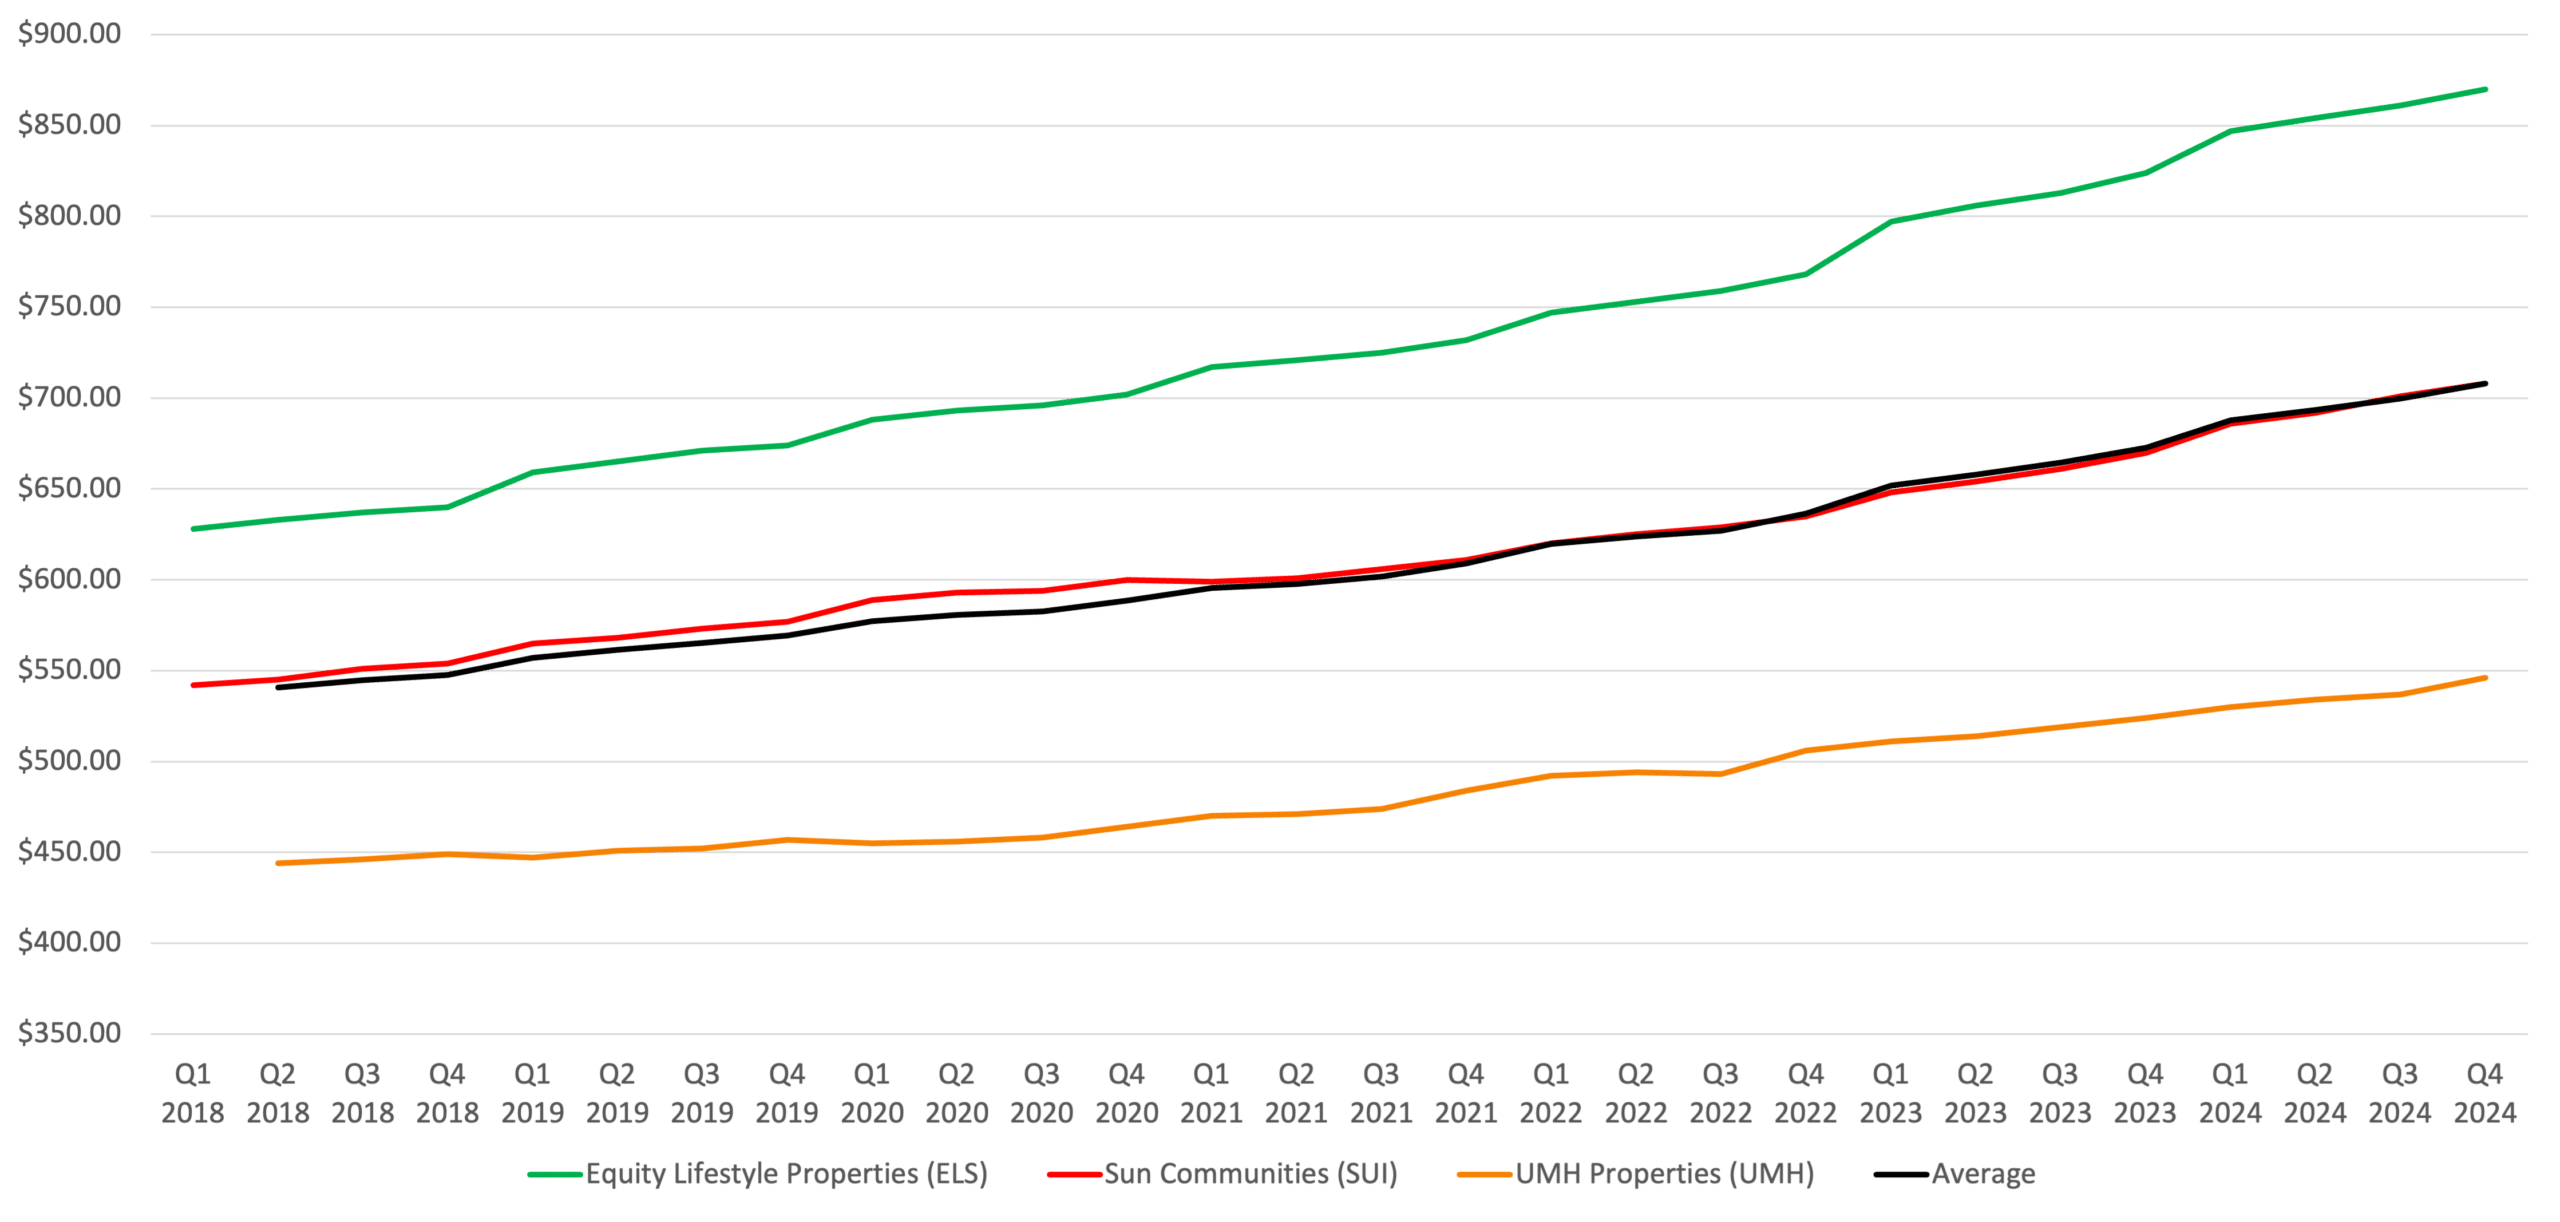
| Rent Per Site (Same Store) | 2024 | $870 | $708 | $546 | |||
| 2023 | $824 | $670 | $524 | ||||
| Q4 MH Acquisitions | 0 | 0 | 0 | ||||
| Total MH Sites | 73,075 | 115,120 | 25,896 | ||||
Q4 2024 Manufactured Housing Operating Fundamentals
Manufactured Housing Rental Rates
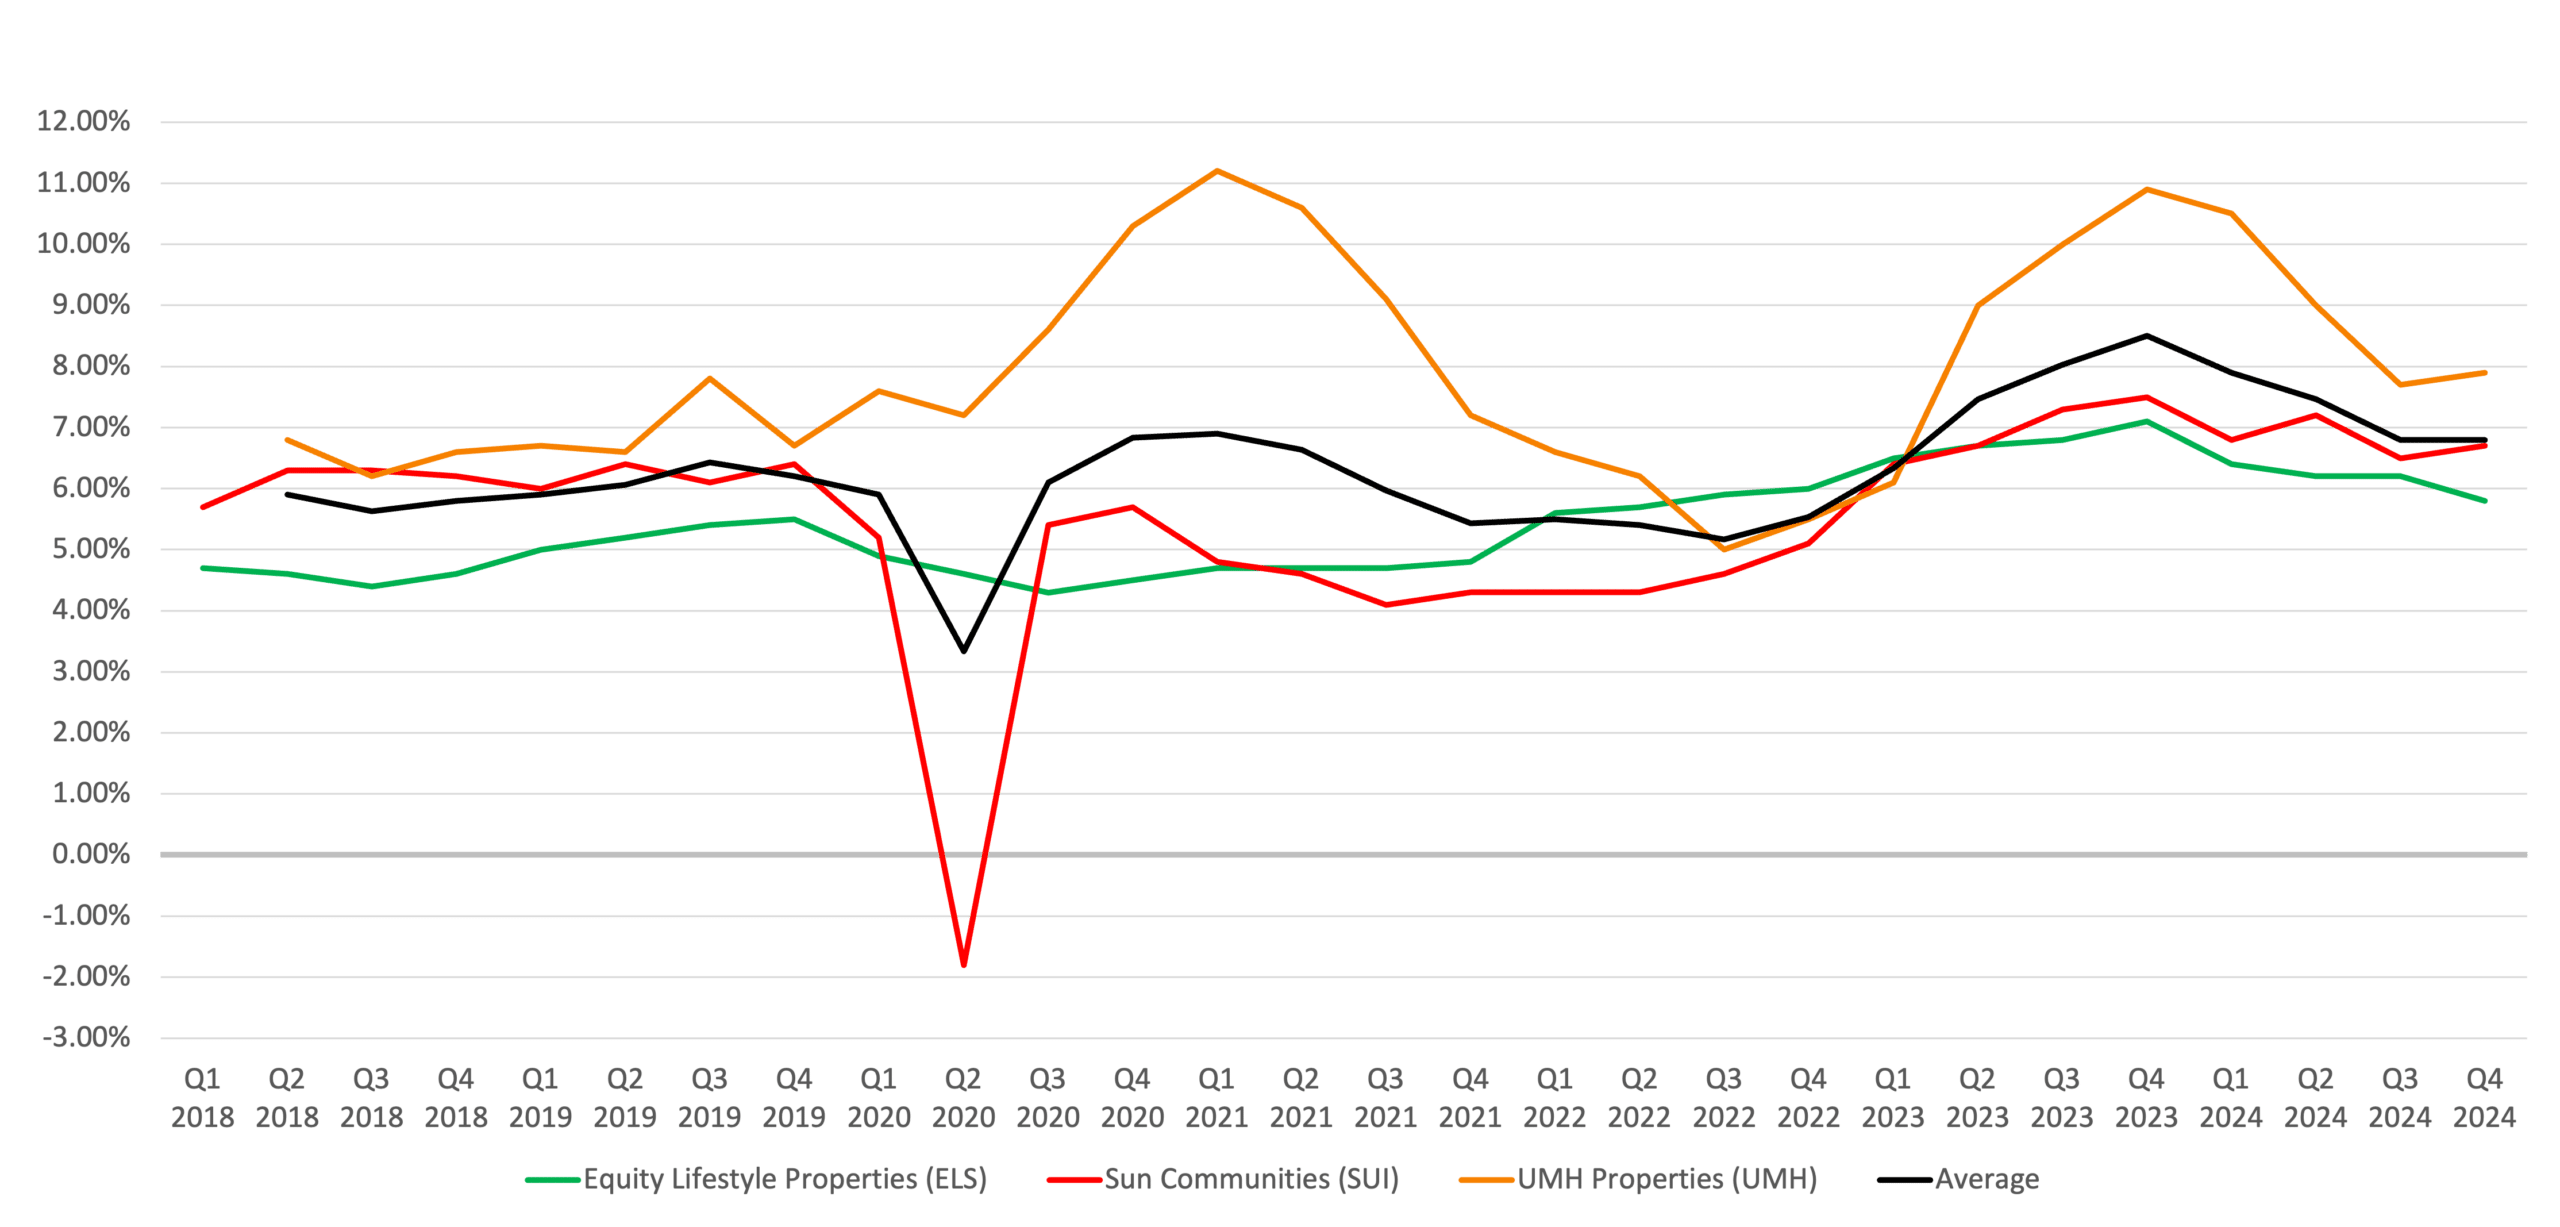
Manufactured housing rental rates across all three REITs demonstrated strong growth in 2024, with rent increases consistently outpacing general inflation and continuing a multi-year trend of stable upward pricing. Equity LifeStyle Properties increased core manufactured housing rents by 5.8% year-over-year, with rents in its Florida and Arizona communities growing even faster due to demand from retirees and seasonal residents. Sun Communities reported a 5.5% increase in weighted average monthly rent across its manufactured housing portfolio, contributing to 6.8% same-property rental revenue growth for the year. UMH Properties raised rental income by 8% across its same-property portfolio. Average rent for new homes placed in UMH communities exceeded $750 per month in 2024, reflecting both higher-quality homes and improved demand dynamics.
Rent per Site (Same Store)
Manufactured Housing Occupancy
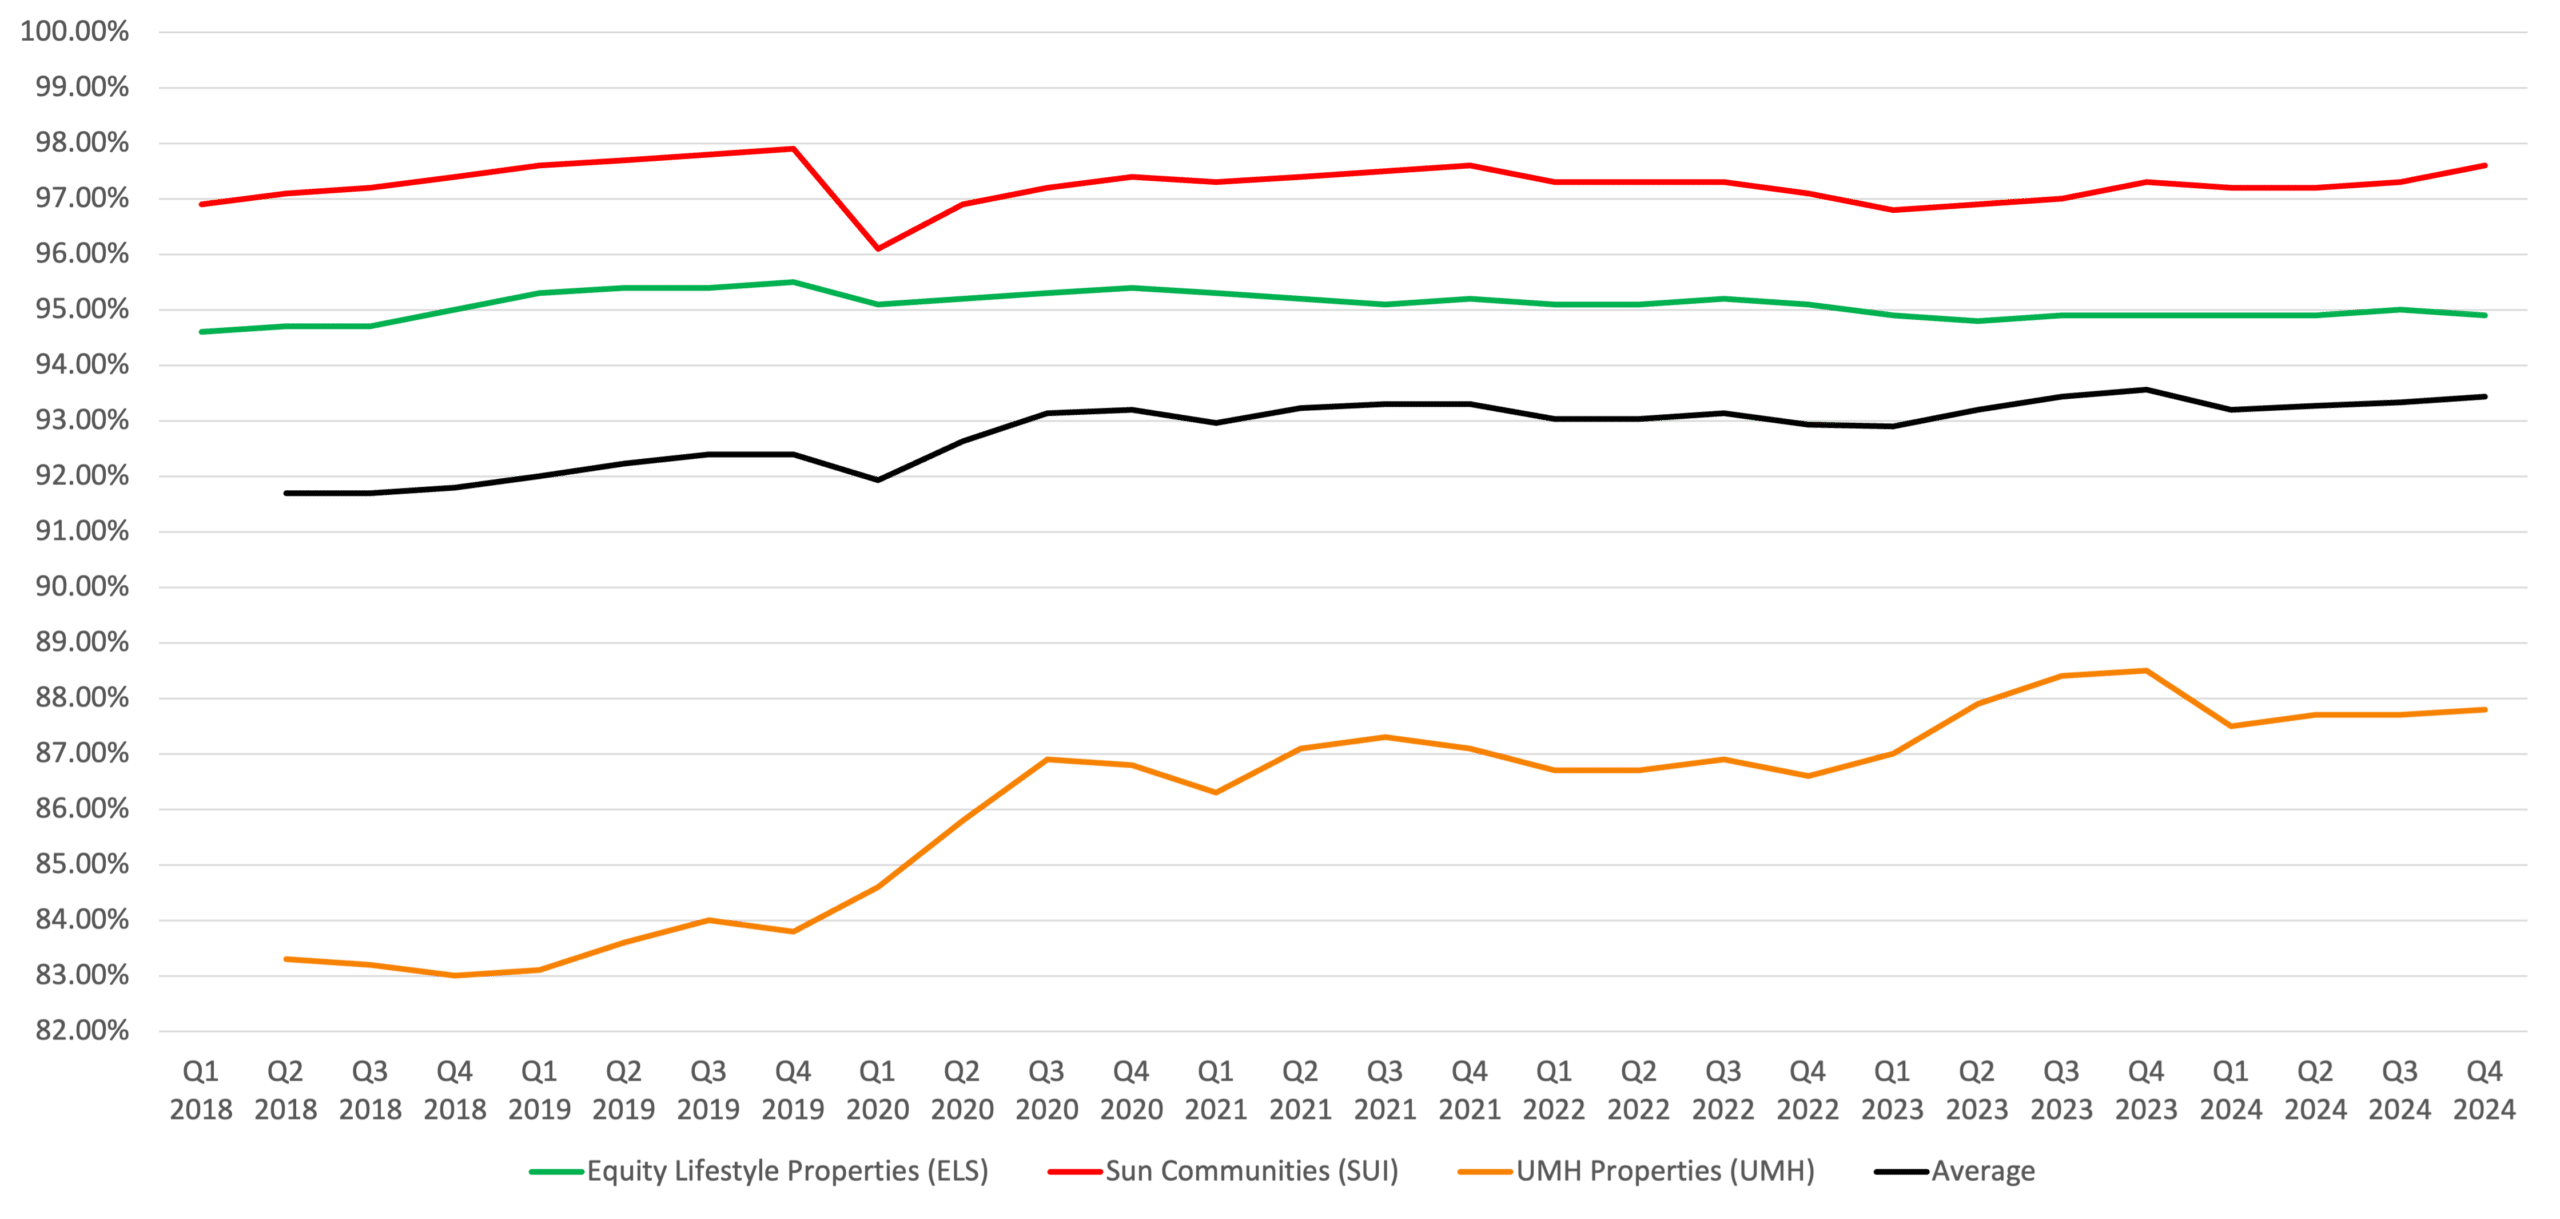
Occupancy within manufactured housing communities remained at or near historical highs, driven by strong resident retention and limited affordable housing alternatives. Equity LifeStyle Properties (ELS) reported high occupancy in key markets, with the California portfolio being more than 98% occupied, and opportunities to increase occupancy above 95% in Florida and Arizona. Sun Communities (SUI) closed 2024 with manufactured housing occupancy at 97.6%. UMH Properties (UMH) reported an increase in occupancy of 216 units, resulting in an increase of 70 basis points, with infill efforts and 190 expansion sites completed in 2024.
Period Ending Occupancy (Same Store)
Manufactured Housing Income & Expenses
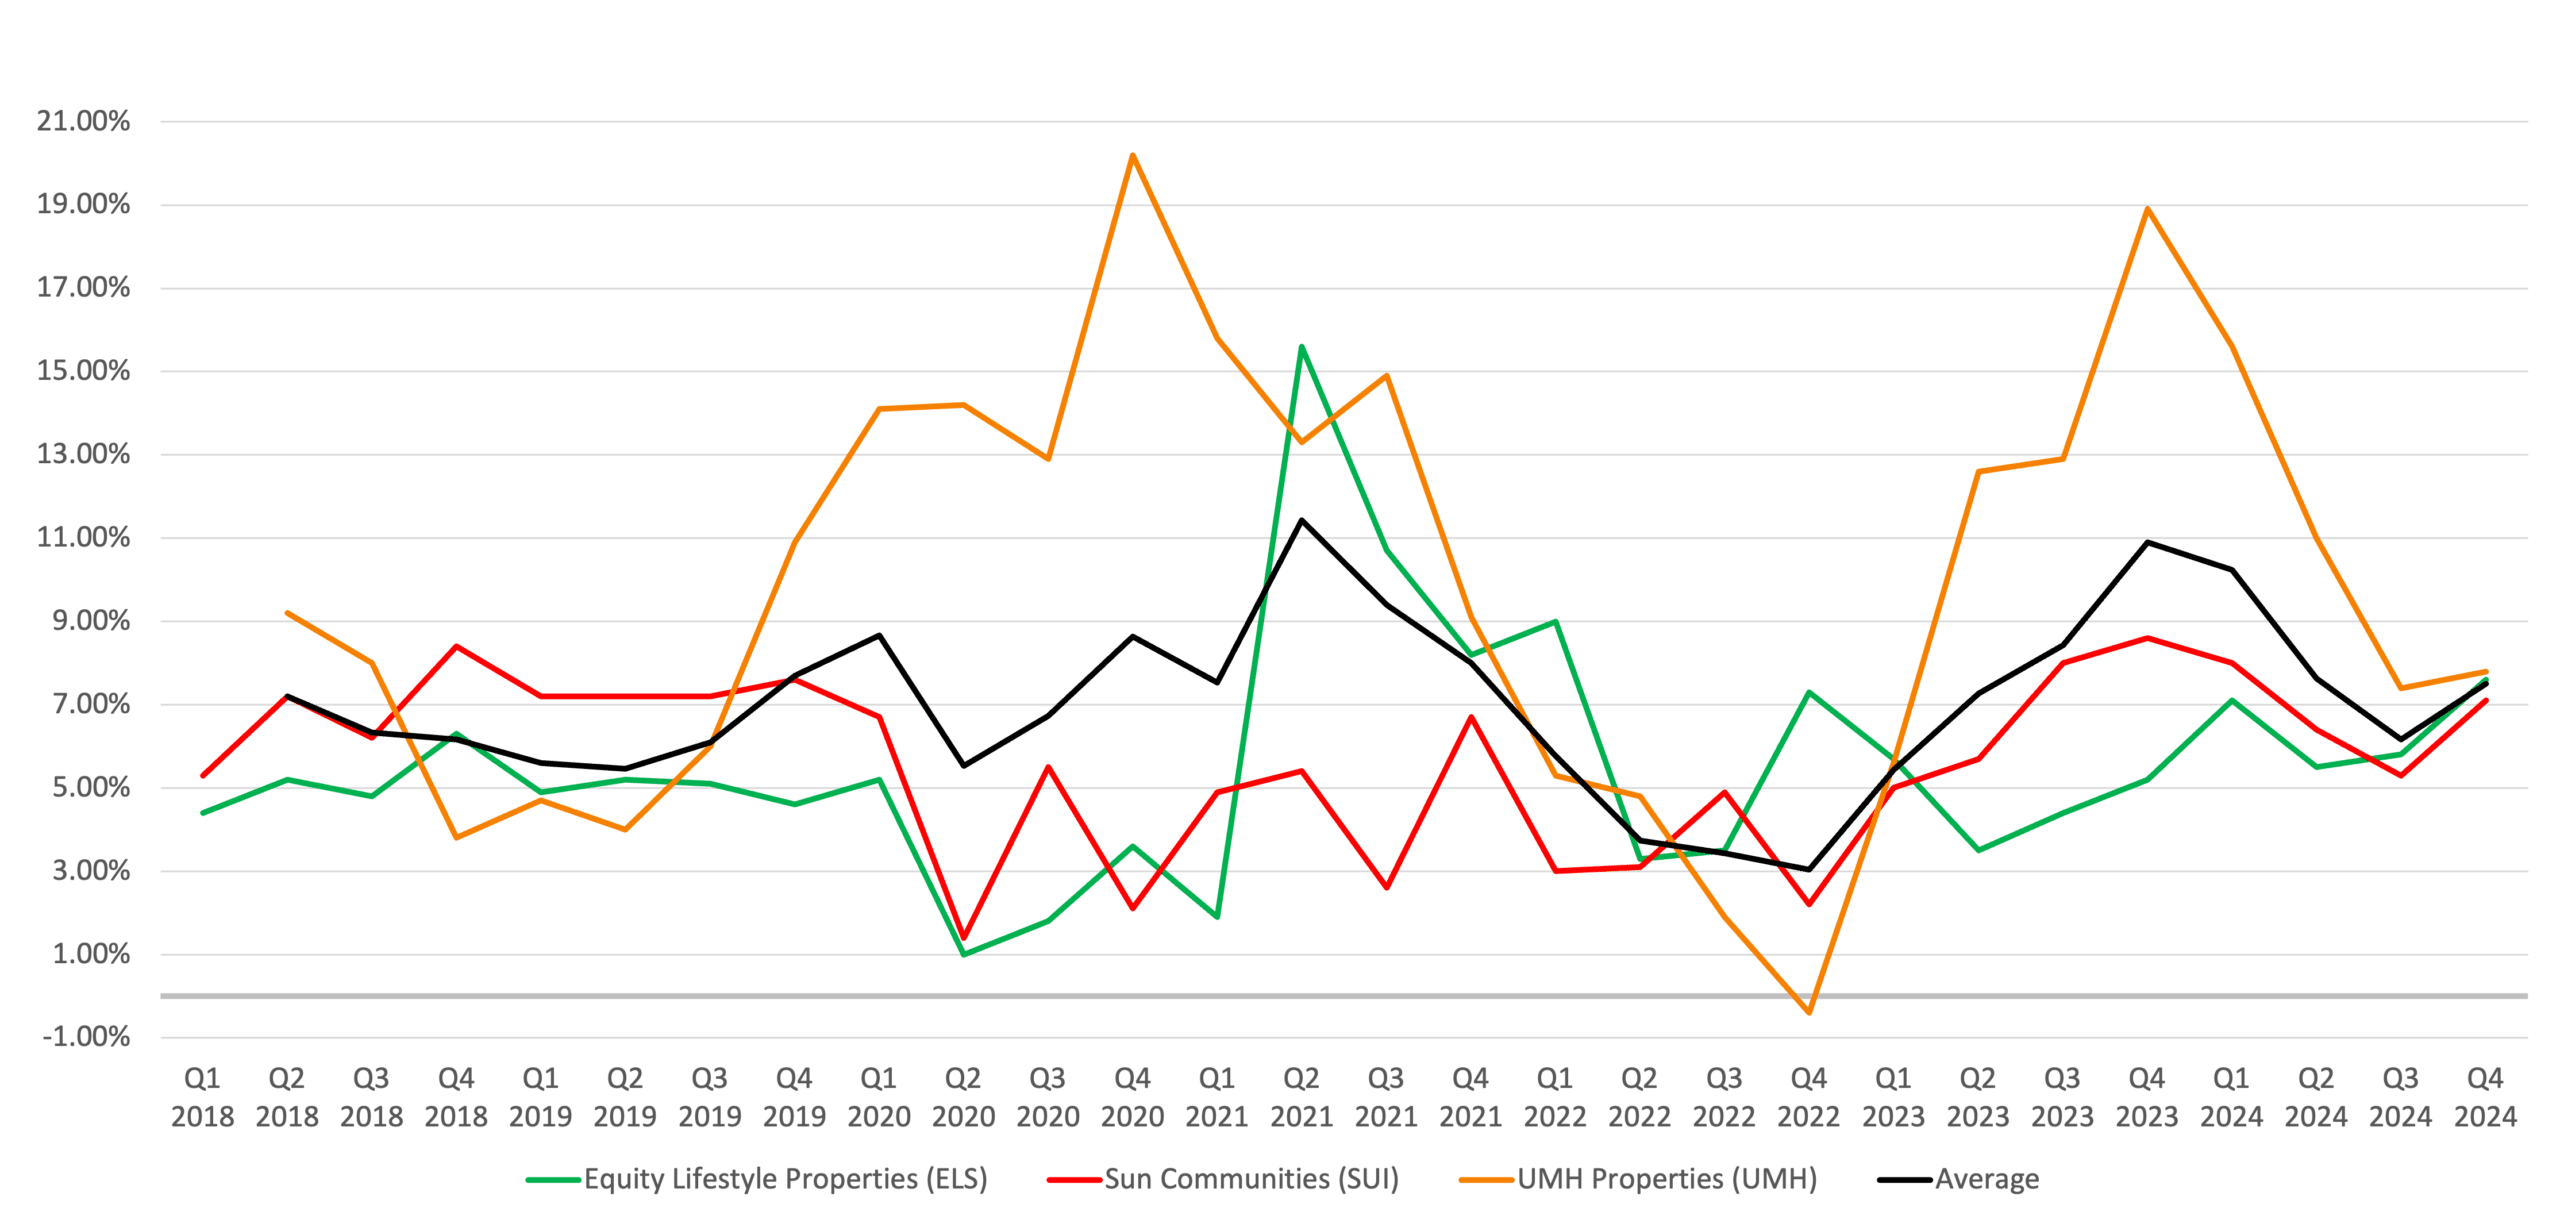
Same-property revenue growth across manufactured housing portfolios was driven by rent increases, occupancy gains, and a growing base of ancillary revenue such as late fees, utility bill-backs, and home sales profits. Equity LifeStyle Properties (ELS) generated 7.6% same-property NOI growth in Q4 and 6.5% for the full year, reflecting steady rent increases combined with careful expense management. Sun Communities (SUI) reported a 6.8% increase in same-property MH revenues for the year. UMH Properties (UMH) achieved a 8% increase in same-property rental income for the year.
REITs faced cost pressures, particularly from insurance premiums, which increased between 15% and 20% year-over-year across all three REITs. This increase reflects rising replacement costs, climate-related risk re-pricing, and concentrated exposure in storm-prone states.
YoY Rental Income Growth (Same Store)
YoY Expense Growth (Same Store)
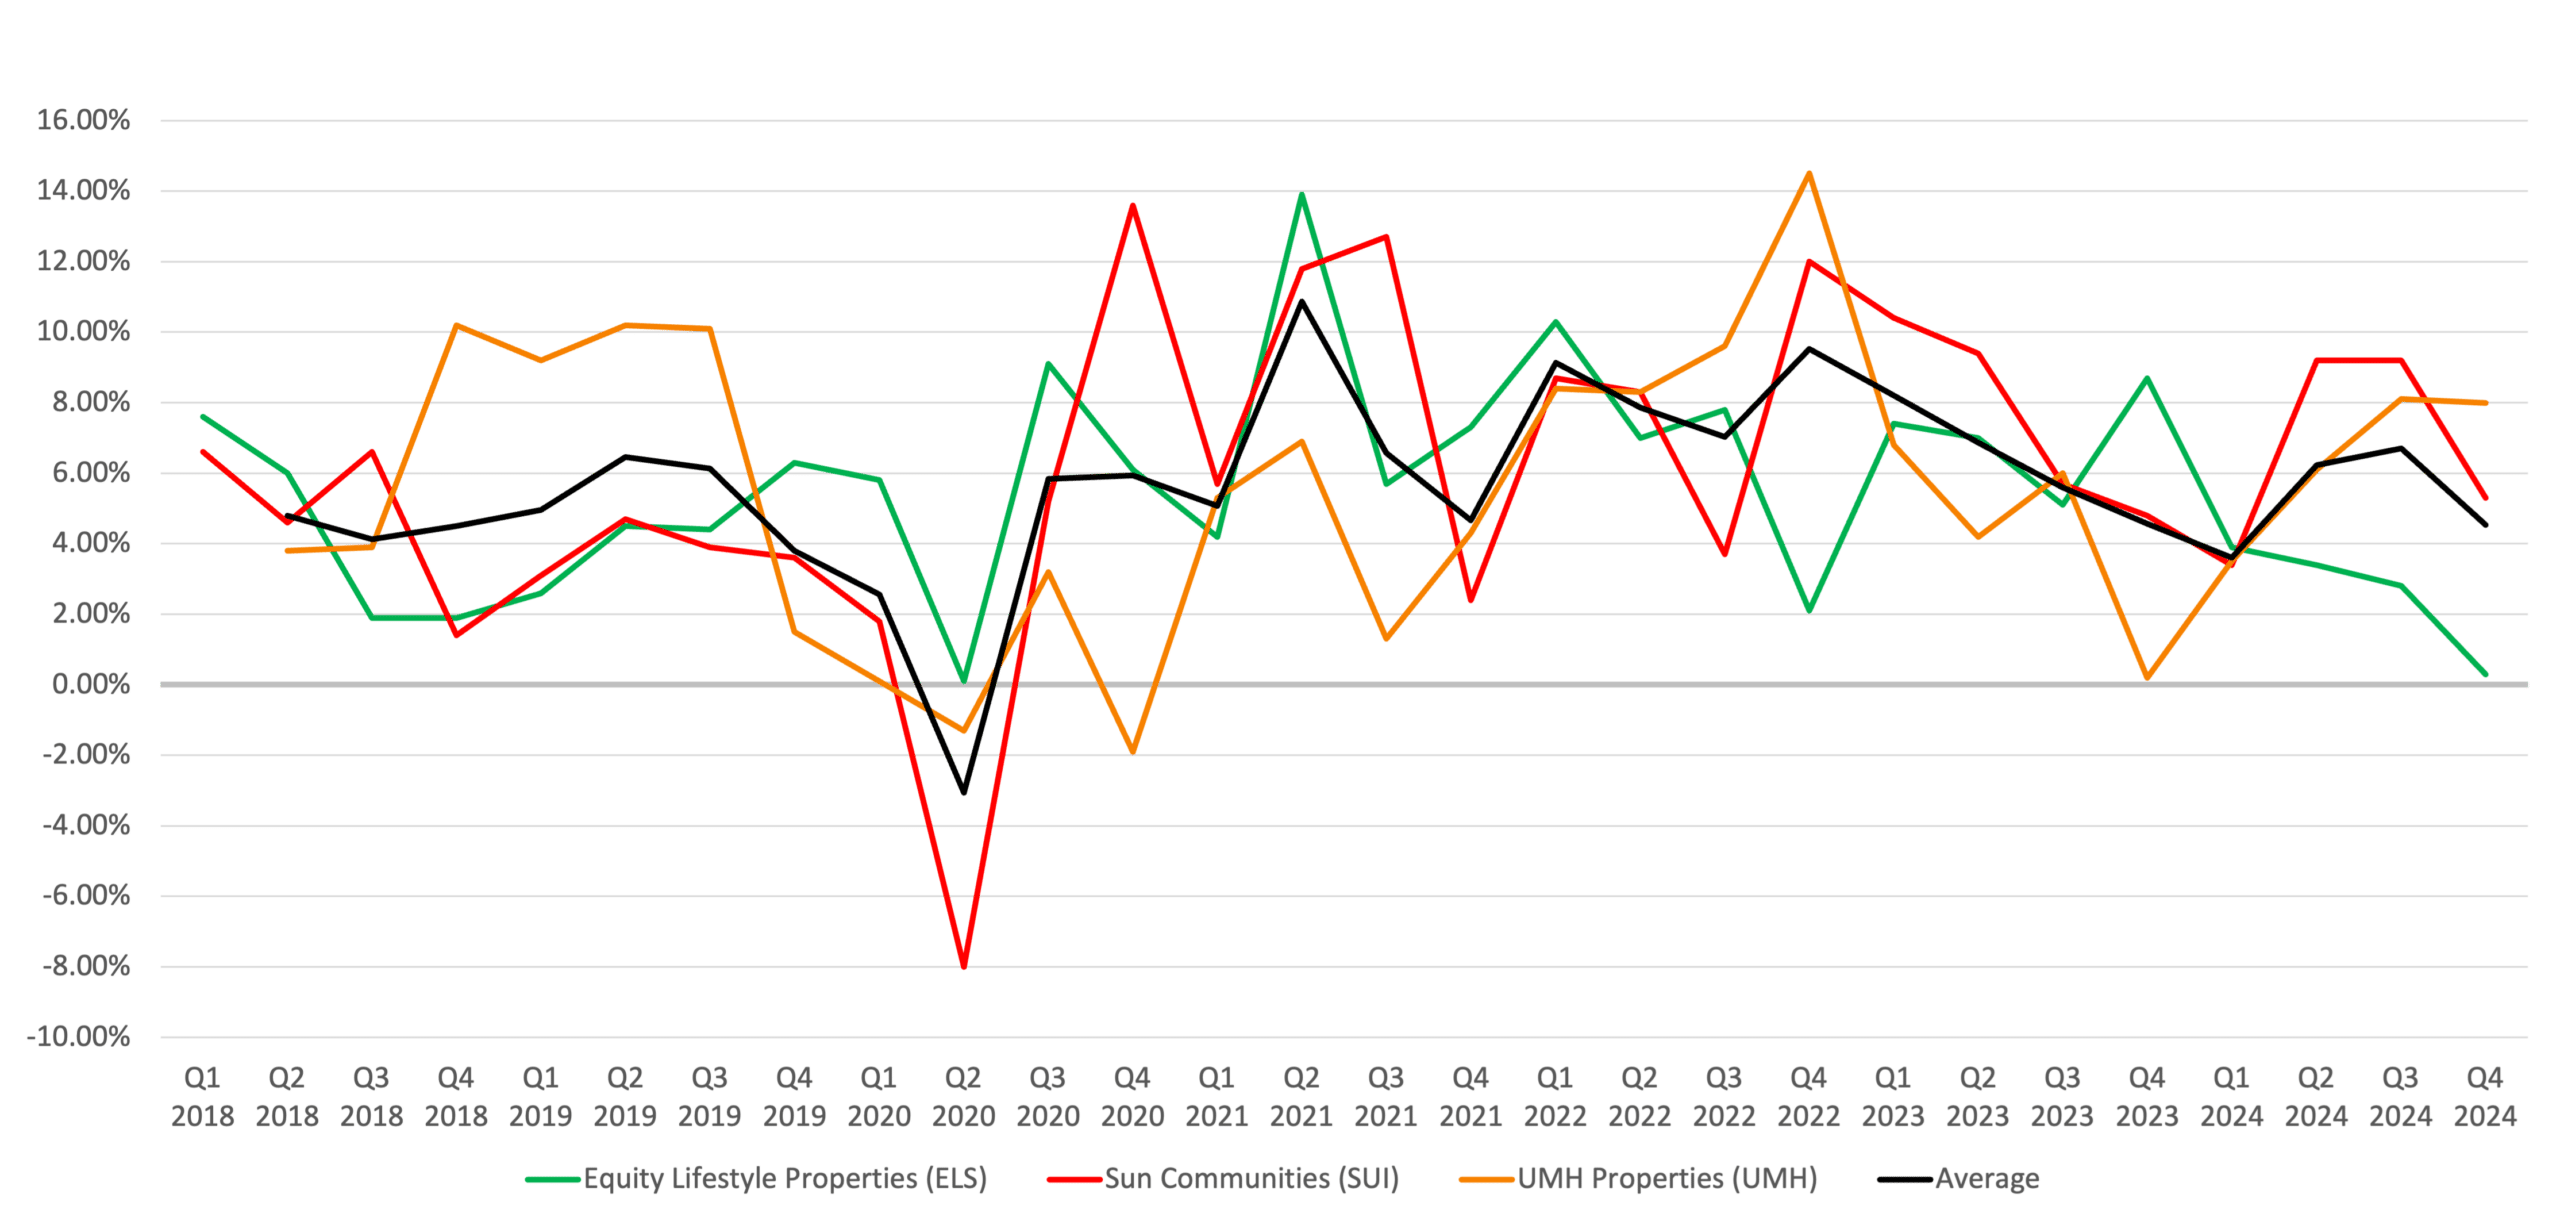
YoY NOI Growth (Same Store)
Manufactured Housing Investment & Transaction Activity
Investment activity in the manufactured housing space was mixed in 2024, as higher borrowing costs and wider bid-ask spreads constrained deal flow. Meanwhile, REITs with strong balance sheets pursued selective acquisitions and internal expansions. Equity LifeStyle Properties (ELS) delivered 736 new homesites through expansion projects, primarily in Florida, Arizona, and South Carolina, and plans to develop approximately 3,000 additional sites in 2025. Sun Communities (SUI) executed approximately $570 million in asset sales, including the high-profile $5.65 billion sale of its Safe Harbor Marinas platform, allowing the company to redeploy capital into core manufactured housing and RV investments while reducing leverage. UMH Properties (UMH) completed 190 expansion sites in 2024, adding to its portfolio, and continues to focus on acquiring communities in need of modernization and infill potential. Across all three REITs, most acquisitions were smaller, one-off transactions, as large portfolio deals remained rare due to valuation gaps between buyers and sellers.
Acquisition Dollar Amount History
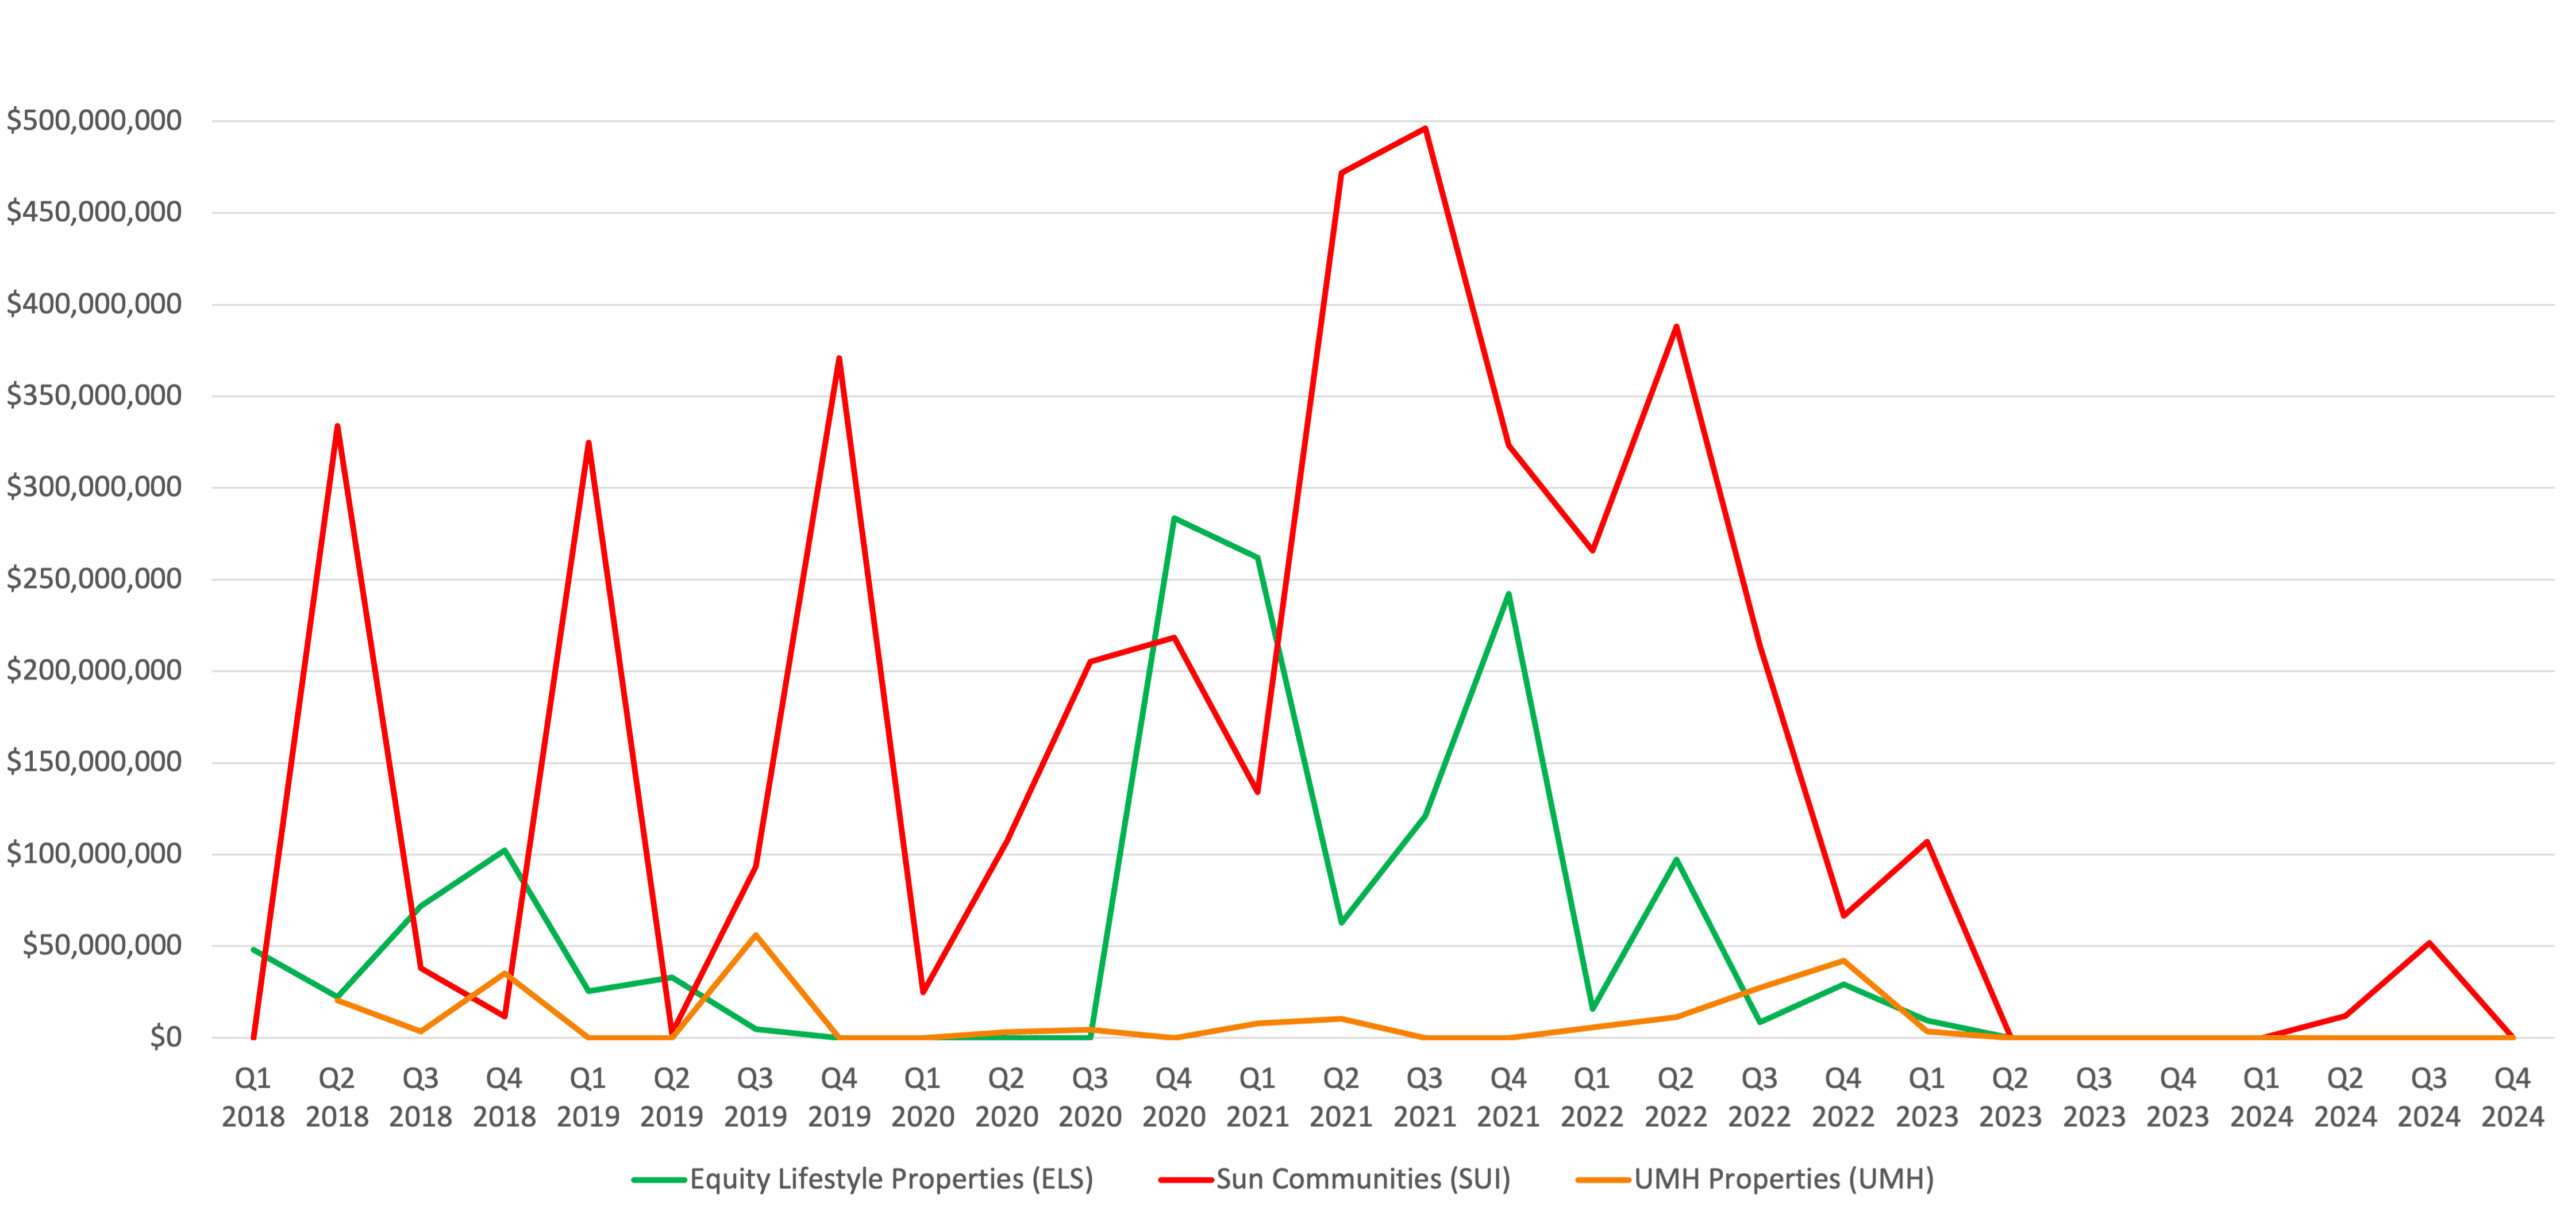
*Excludes Sun Communities Acquisition of Park Holidays in April 2022 for $1.2 Billion
Manufactured Housing Monthly Transactions 2018-2024
* Source: CoStar
Manufactured Housing Cap Rates & Bid-Ask Spread
Cap rates for stabilized manufactured housing communities in 2024 generally hovered around 5.5%, as reported by UMH Properties, which pursued acquisitions at this level with expectations for upside through infill development and rental growth. While Sun Communities and Equity LifeStyle Properties (ELS) did not explicitly disclose cap rates, both emphasized strong demand in Sunbelt markets like Florida, Arizona, and California, where occupancy and revenue growth trends supported valuations. The bid-ask spread remained wide throughout the year, as private sellers, particularly mom-and-pop owners, held onto peak 2021 pricing, while institutional buyers adjusted underwriting models to account for higher debt costs and more conservative rent growth assumptions.
With large portfolio transactions mostly at a standstill, market activity was dominated by single-asset, off-market transactions, where pricing flexibility was greater. UMH anticipated more acquisition opportunities emerging in 2025 as refinancing pressures pushed private owners to sell, with a reported pipeline of four communities under contract at a blended 5.5% cap rate.
Implied Cap Rate History
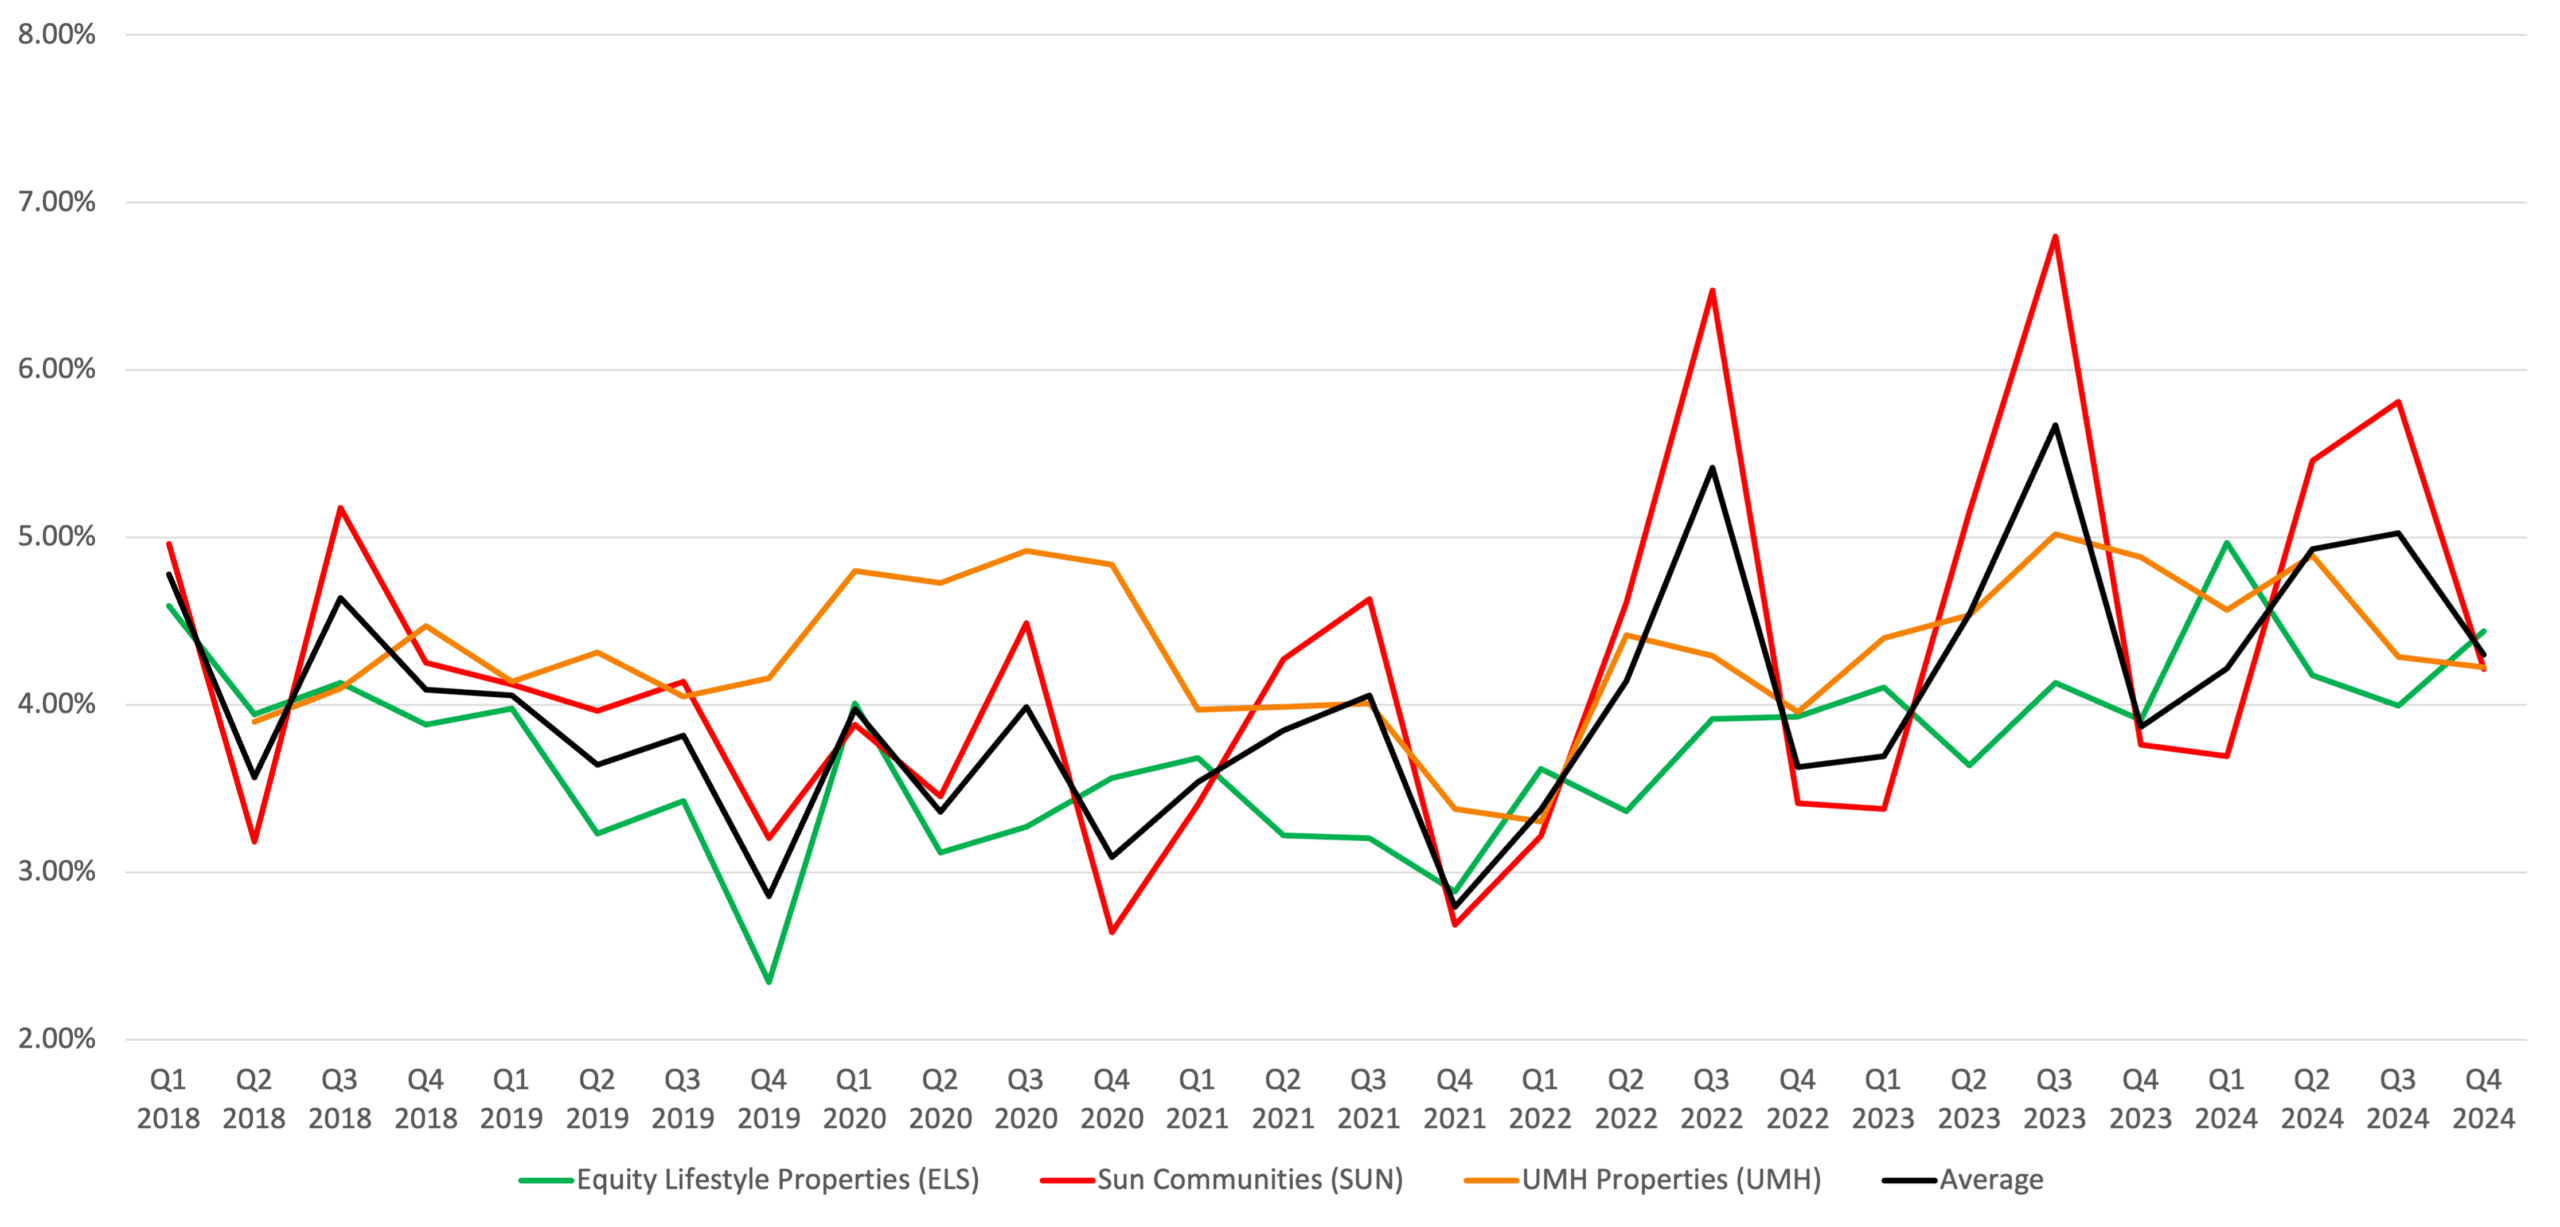
*The implied cap rate data indicates the market value of each REIT.
The implied capitalization rate is a culmination of the company value and total debt of each company divided by its NOI.
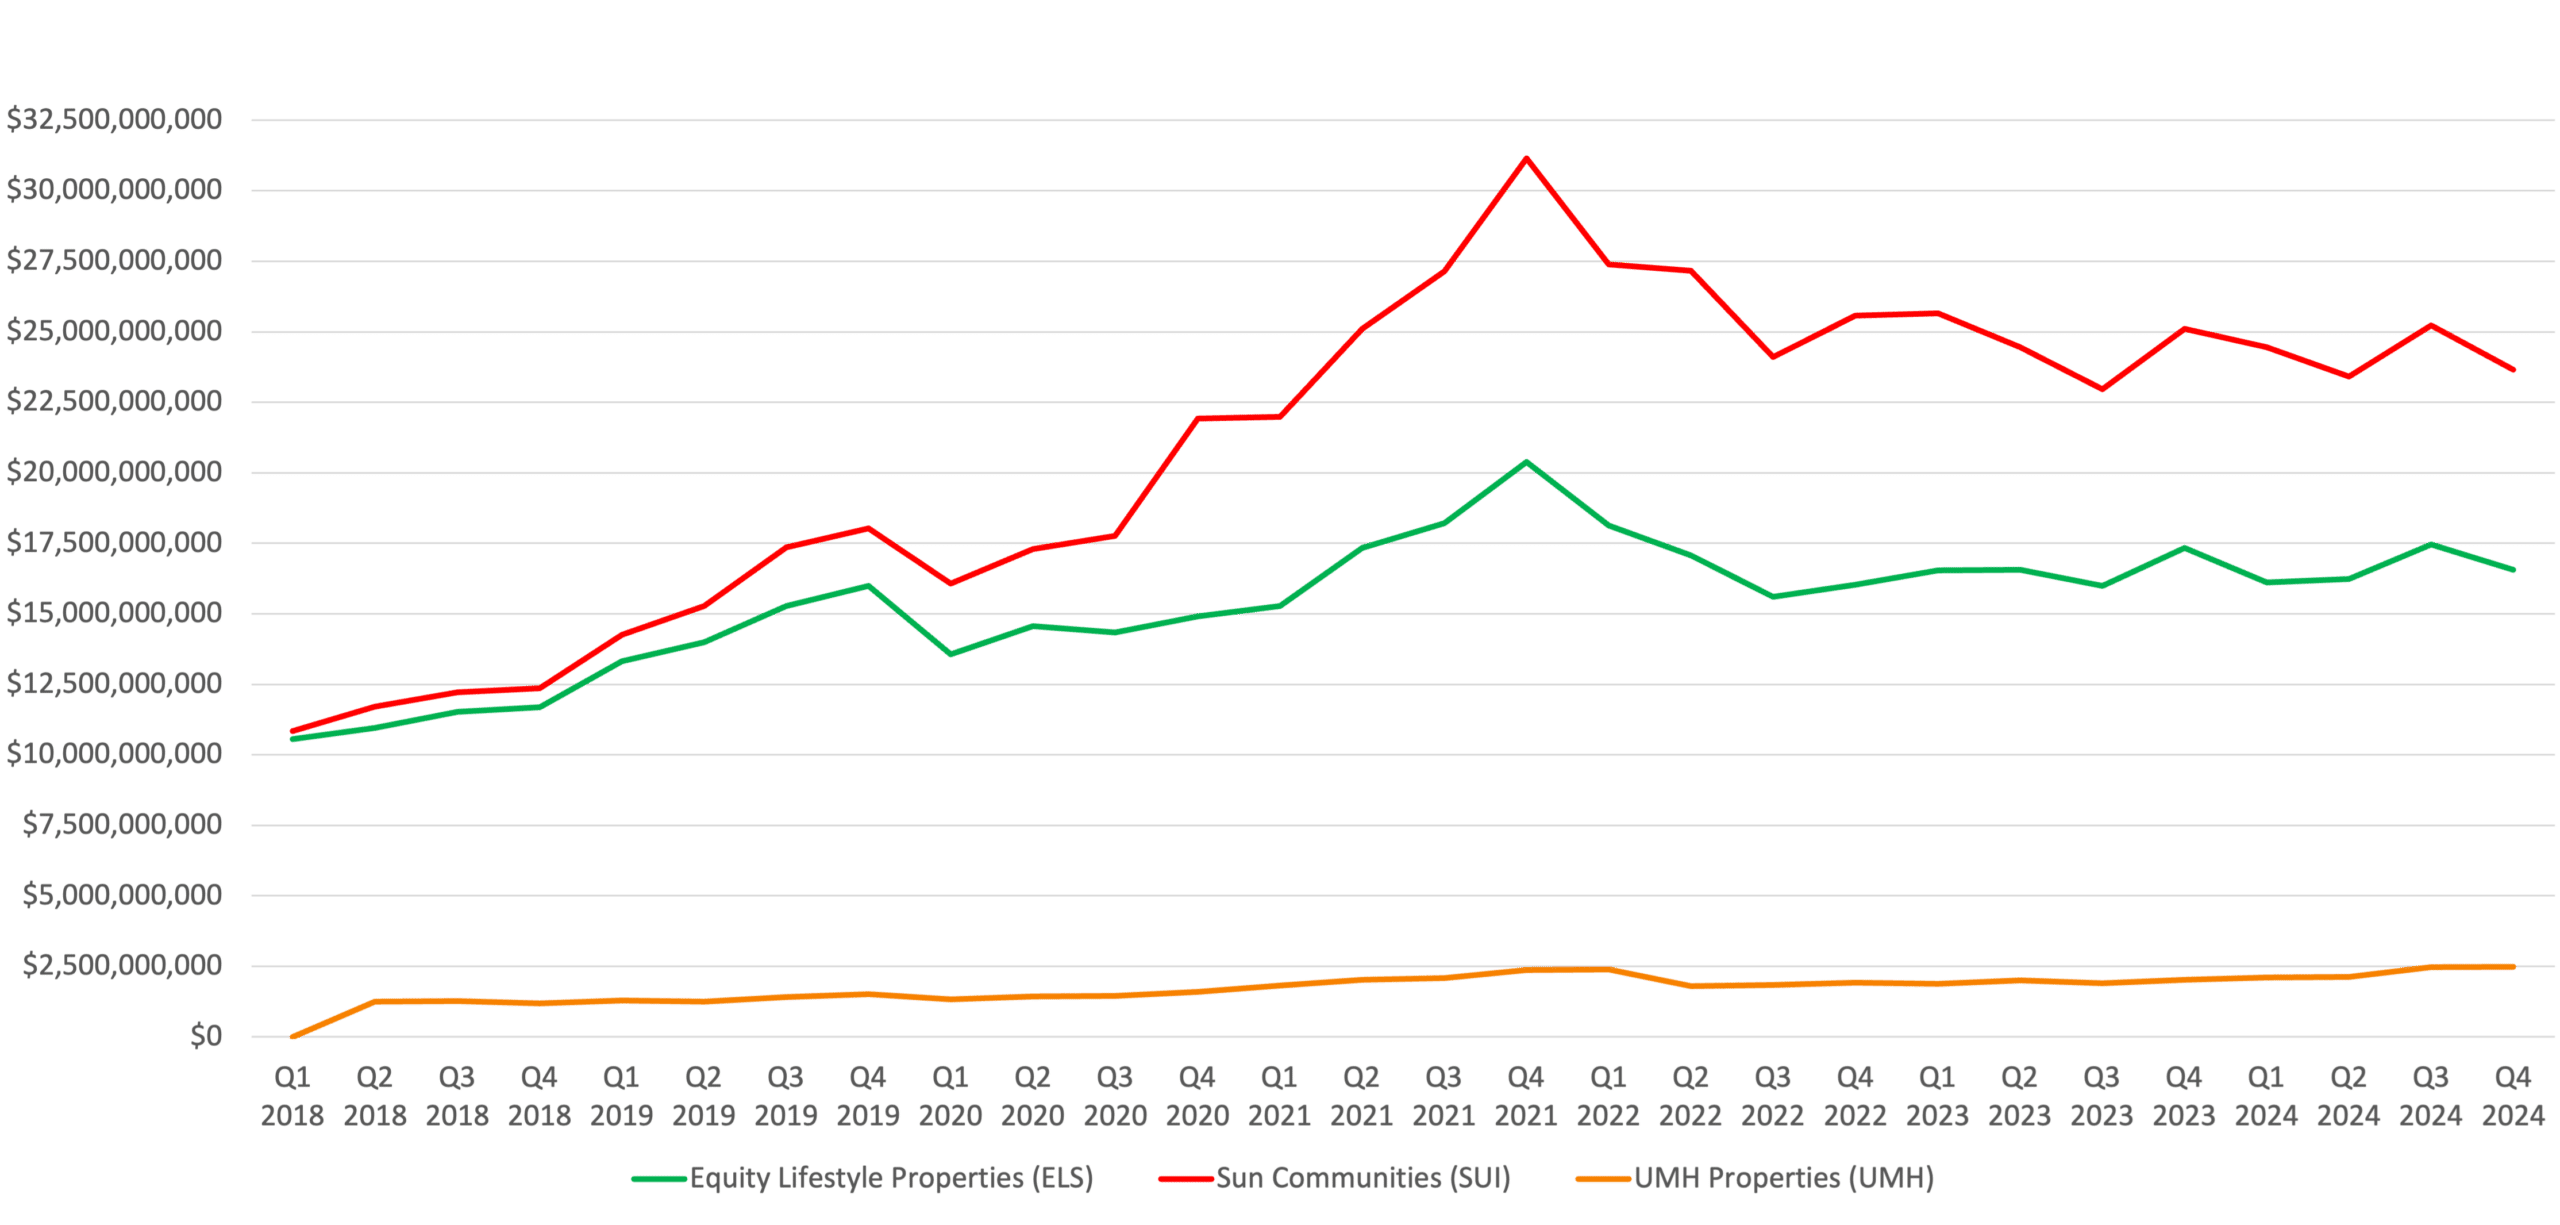
Enterprise Value History
Headwinds in the Manufactured Housing Market
Despite the sector’s strengths, several challenges persist. Rising operating expenses are a significant concern, with property taxes expected to increase by 5% to 8% in many Sunbelt states, and reassessments leading to sharper increases in Florida and Texas. Insurance premiums, which also rose in 2024, are likely to continue climbing due to climate risk adjustments. Additionally, labor costs, particularly for skilled trades needed to maintain aging infrastructure in legacy communities, pose ongoing challenges.
Regulatory risks are also increasing, particularly in California, where expanded rent control legislation limits annual rent increases in several jurisdictions, impacting revenue growth. Zoning and entitlement delays further complicate expansion projects, especially in high-growth areas. Moreover, high mortgage rates and reduced mobility are slowing housing turnover, affecting move-in demand, particularly in communities targeting first-time homebuyers.
Tailwinds in the Manufactured Housing Market
The manufactured housing sector continues to demonstrate resilience and growth amid economic uncertainties, driven by several key factors. One of the primary advantages is the affordability of manufactured housing, which offers a cost-effective path to homeownership. New homes in ELS and UMH communities are priced between $80,000 and $90,000, significantly lower than the median price for new site-built homes. This affordability ensures sustained demand, particularly among cost-burdened households.
Demographic trends also support the sector’s growth. Sunbelt migration remains strong, with states like Florida experiencing significant population growth, especially among retirees and downsizing households. This demographic shift supports demand for age-restricted manufactured housing communities. Additionally, investments in technology across all three REITs are enhancing operational efficiency. Dynamic pricing algorithms, centralized leasing platforms, and AI-enhanced marketing strategies are improving lead conversion rates and operational margins.
Contributors
Steven Paul
Senior Financial Analyst
Jared Bosch
Senior VP & Director of Manufactured Housing
Don Vedeen
Senior VP & Director of Manufactured Housing