
Below, the SkyView team offers insights on the latest rent and supply trends in Yardi Matrix’s top metropolitan areas, covering the most prominent regions of the United States.
In Yardi’s April report, the focus shifts to seasonal trends as we enter spring leasing season across the country. Yardi notes that street rates continued to normalize in the beginning of 2023 with demand continuing to anchor the asset class; rates remain firm and slightly increased in some major metro areas. Busy leasing season is approaching, which will justify rate increases as we continue into the next few months. Self Storage is continuing to show resilience despite turmoil in the financial markets, as the demand for storage has been minimally impacted by outside economic headwinds.
The market is trending towards a return to normalcy. Seasonality trends were not as prominent during the height of COVID, but now those historcial tendencies are expected to fully return as we continue into quarter two of 2023.
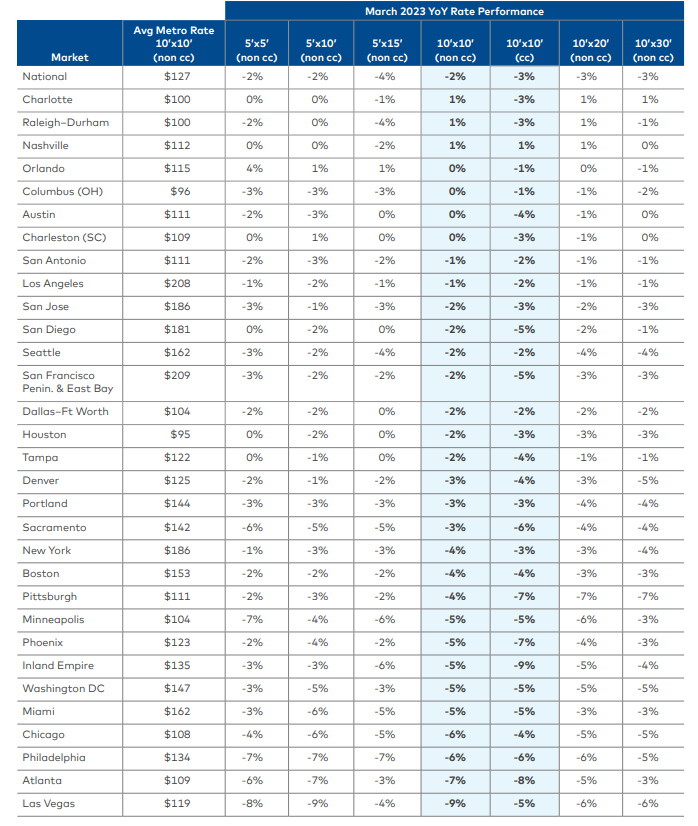
Non-climate 10×10 unit rates are down 2.3 percent, while 10×10 climate-controlled rates were down 3.4 percent.
Street rates still remain well above pre-pandemic levels. Steady patterns are still evident, with various unit types and sizes witnessing rate increases month-over-month, according to Yardi Matrix.
Overall, climate and non-climate rate increases on 10×10 units checked-in under one percent in the latest report, further justifying a soft landing as opposed to a drastic change when comparing rates to historical norms.
The majority of Yardi’s top metro areas demonstrated negative street rate growth in April compared to March. This is more in line with historical rate trends as opposed to larger fluctuations observed throughout 2022.
*Street rates for climate and non-climate controlled units are starting to slowly rise again after witnessing a consistent slight decline dating back to the middle of 2022.
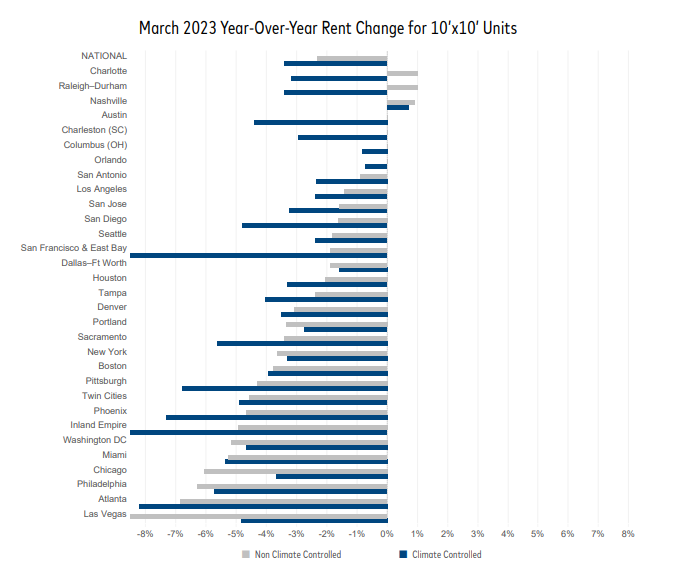
Below is the year-over-year rent change for 10×10 units in 31 of Yardi’s top metro areas in March 2023, reflective of the latest data available.
*Data Courtesy of Yardi Matrix
Nashville demonstrated the strongest 10×10 climate-controlled rent growth out of all Yardi’s top metro areas listed above, with an increase just under one percent. Raleigh-Durham and Charlotte experienced the highest growth in 10×10 non-climate-controlled units at approximately one percent.
The San Francisco & East Bay Metro, Inland Empire, and Atlanta demonstrated the sharpest declines in 10×10 climate-controlled rental rates, while Las Vegas experienced the sharpest decline in 10×10 non-climate-controlled units in March.
Throughout 2023, trends have shown that Yardi’s metros in North Carolina and in Nashville, Tennessee are experiencing the most consistent growth. While metros such as Las Vegas and Atlanta continue to experience some of the sharpest declines this year.
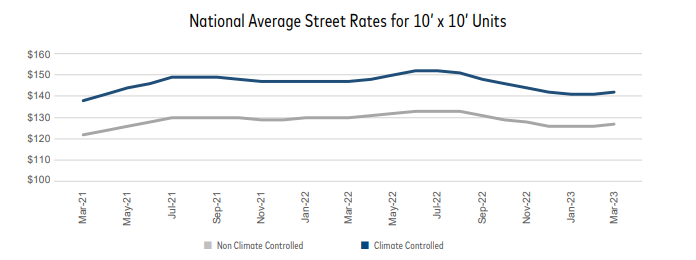
Below the breakdown of national average street rates for 10×10 units drawn from over 32,000 stores across the nation, including a small portion of projects in the new-supply pipeline.
*Data Courtesy of Yardi Matrix
The chart above demonstrates the trajectory of rental rate fluctuation since March of 2021. National average street rates, as mentioned previously, have remained healthy compared to historical trends.
As indicated in the visual above, the industry witnessed rental rate growth from March 2021 through June of 2022, before leveling off and experiencing a slight decline to end the year and begin 2023.
To begin 2023, the slight declines in street rates continued. However, in March there has been a slight increase in street rates among both climate and non-climate controlled units.
With a strong demand for storage due to the necessity of the asset and a lack of development over the past year, performance still remains robust overall.
The chart below indicates the under-construction supply by percentage of existing inventory nationally, based on 32,668 stores. Data as of April 7,2023 from Yardi Matrix.
*Data Courtesy of Yardi Matrix
The latest report indicates a slight uptick in national under-construction supply percentage, moving from 3.6 percent to 3.7 percent during February to March.
The latest report indicates that Boston, Phoenix, Miami, and San Antonio witnessed under-construction supply increases, while Austin, Chicago, and Las Vegas experienced a decline. The remainder of Yardi’s top metros experienced no change in under-supply construction percentage.
Below is a monthly rate recap of March 2023 year-over-year rate performance, beginning with the Yardi’s national rate recap, followed by metrics in 31 major metros across the United States. Rate performances encompass the most in-demand climate-controlled and non-climate-controlled storage options.
To strategize with the industry experts, click below to discuss the best plan for maximizing your asset in the current market.
*All data from this analysis was derived from Yardi Matrix
Stay up-to-date on the latest self-storage news and insights.
Speak with an Expert
In connection with a potential business transaction concerning Self Storage Update | April 2023 Rate and Supply Trends (the “Transaction”), JDS Real Estate Services, Inc (“Discloser”) may disclose to [COMPANY] (“Recipient”) certain confidential and proprietary information (“Confidential Information”). Confidential Information shall specifically include the fact that the Transaction is being considered. To protect the Confidential Information, the parties hereto mutually agree as follows:
1. Confidential Information may be marked, orally identified as confidential (and subsequently confirmed in writing) or exchanged under circumstances in which it is reasonable to presume it is confidential. Information shall not be deemed Confidential Information if it is: (a) already known to the receiving party, free of restriction when disclosed; (b) is or becomes publicly available through no wrongful act or breach of this Agreement; (c) rightfully received from a third party reasonably known to be without restriction; (d) independently developed without use of or reference to Confidential Information; (e) required to be disclosed by applicable law, regulation, or order of a court of competent jurisdiction; or (f) necessary in the defense of any claim or litigation arising hereunder.
2.Recipient agrees: (a) to regard and preserve as strictly confidential and proprietary, all Confidential Information obtained from Discloser in connection with the Transaction; (b) not, without the prior written consent of Discloser, to disclose the Confidential Information to any person, firm or enterprise, or use the Confidential Information in any manner unrelated to the Transaction; (c) to limit disclosure to their own employees or independent contractors on a “need to know” basis; and (d) upon request, to promptly return or destroy all Confidential Information under their control or in their possession provided, however, Recipient may retain one (1) copy of any Confidential Information, including summaries, compilations or analyses thereof to the extent: (i) required by applicable law or regulation; (ii) required by Recipient’s internal document retention and governance policies; or (iii) would be unreasonably burdensome to destroy (such as any part of the Confidential Information contained in an archived computer system backup). Any Confidential Information retained pursuant to subsections (i), (ii) or (iii) shall continue to be treated as Confidential Information subject to the restrictions set forth in this Agreement, notwithstanding any termination or expiration thereof. The parties hereof agree that money damages would not be a sufficient remedy for any breach of this Agreement, and that Discloser shall be entitled to seek equitable relief as a remedy in addition to all other remedies available at law or in equity. Under no event shall Recipient be liable to Discloser for punitive or consequential damages or lost profits.
3. The Parties agree that references to Recipient shall be meant to apply to only those individuals who are engaged in the Transaction and no other employees, sales associates or officers of Recipient and/or its affiliates
4. This Agreement (a) contains the entire understanding of the parties with respect to the subject matter hereof, (b) may not be changed or modified orally but only by written instrument signed by the parties hereto; (c) is non-assignable and shall expire no sooner than one (1) year from the date of the last disclosure of Confidential Information hereunder; (d) shall be governed by and construed in accordance with the laws of the State of Florida; and (e) may not be strictly construed against either party, each party agreeing that it has participated fully and equally in the preparation of this Agreement.
5. This Agreement may be executed in any number of counterparts, each of which shall be deemed an original and all of which together shall constitute a fully executed agreement, with the same effect and validity as a single, original agreement signed by all of the parties. Facsimile signatures shall have the same validity and effect as original signatures. This Agreement may be signed in any number of counterparts, which together shall constitute a single, fully executed Agreement, as though all of the parties signed the same Agreement
The following information from your profile will be used in the agreement:
THIS NONDISCLOSURE AGREEMENT (this “Agreement”), made as of this 27th day of July, 2024 (the “Effective Date”) [COMPANY], a [COMPANY TYPE], and its affiliates, (“Recipient”), with an address of [ADDRESS], for the benefit of Skyview Advisors LLC (“Discloser”), with an address of 100 N Ashley Dr, Suite 600 | Tampa, FL 33602 (collectively, Recipient and Discloser are the “Parties”).
WHEREAS, Recipient been advised that Discloser is acting as the exclusive agent to the owner of the property known as Self Storage Update | April 2023 Rate and Supply Trends and located at (the “Property”);
WHEREAS, Discloser is willing to provide to Recipient the certain information pursuant to the terms set forth herein in order to facilitate a potential transaction between Recipient and the owner to the Property in connection with the Property (the “Transaction”);
WHEREAS, subject to full execution of this Agreement by all Parties, the Discloser intends to provide Recipient with certain proprietary and confidential information as determined by Discloser relating to the Transaction. All of the information listed above, and any other reports, materials or information obtained by Recipient and its affiliates and/or their respective employees, attorneys or accountants (collectively, “Representatives”), without regard to whether a court of law would deem such materials confidential or privileged, are collectively referred to as the “Confidential Information.”
NOW, THEREFORE, in consideration of the undertakings, and subject to the terms and conditions set forth in this Agreement, as a condition to the disclosure by Discloser to Recipient of any Confidential Information, the Parties agree as follows:
1. Confidentiality and Nondisclosure
(a) Recipient agrees that it will not, directly or indirectly, without the prior written consent of Discloser, disclose or authorize or permit anyone under its direction to disclose to anyone any of such Confidential Information; provided, however, that Recipient may disclose the Confidential Information to those of its Representatives who are engaged to assist in the review of the Transaction if Recipient provides its Representatives with a copy of this Agreement and informs its Representatives of its obligations hereunder. Recipient agrees that neither it nor the Representatives will use any Confidential Information other than in connection with the evaluation of the Transaction.
(b) Recipient and its Representatives will not, without the prior written consent of Discloser, disclose to any person the fact that the Confidential Information exists or has been made available, that Recipient is considering the Transaction, or that discussions or negotiations are taking or have taken place concerning the Transaction, or any term, condition or other fact relating to the Transaction or such discussions or negotiations, including without limitation, the status thereof.
(c) Confidential Information shall not include information which has come within the public domain through no fault or action by Recipient or information which is obtained after the Effective Date by Recipient from any third party which is lawfully in possession of such information and not in violation of any contractual or legal obligation with respect to such information; provided that, with respect to any of the foregoing exceptions, Recipient will, within ten (10) business days of any request therefor by Discloser, provide Discloser with satisfactory written evidence that such Confidential Information is or was within the public domain, or obtained from a third party having lawful possession thereof, as the case may be, at the time such disclosure was made to Recipient.
(d) Recipient and its Representatives will not discuss any details of the Confidential Information with any third-party except as otherwise provided herein.
(e) Recipient agrees that neither the Discloser nor its agents shall have any liability to Recipient resulting from the use of the Confidential Information supplied hereunder, except that nothing herein shall waive any rights or obligations Recipient or Discloser or its agents may have with respect to the contents of the Confidential Information.
(f) Recipient acknowledges that it has been advised that the Property may be viewed by appointment only and Recipient specifically agrees that it shall not attempt to view, visit or otherwise gain access to the Property unless and until Discloser has scheduled an appointment for Recipient to do so.
2. Non-Circumvent
In consideration of Discloser’s disclosure of the Confidential Information, and without limiting anything else set forth herein, neither Recipient nor any of its Representatives shall at any time prior to the date immediately preceding the second (2nd) anniversary date of this Agreement, without the prior written consent of Discloser, which consent may be withheld by Discloser in its sole discretion, take any action, directly or indirectly, to undertake the Transaction including, without limitation, attempting in any manner, directly or indirectly, to contact a potential seller or any of its shareholders, officers, directors, or affiliates, introduced or revealed to Recipient by Discloser, to undertake or complete the Transaction.
3. Destruction/Return of Confidential Information
Recipient, upon the request of Discloser, will either (a) promptly destroy all copies of the written Confidential Information in Recipient’s and/or any Representative’s possession, including but not limited to written summaries of any oral analyses, compilations, studies, or other documents prepared by the Recipient or any Representative in connection with the Transaction or provided by Discloser, and confirm such destruction to Discloser in writing, or (b) promptly deliver to Discloser, at Recipient’s own expense, all copies of such written Confidential Information in Recipient’s and/or any Representative’s possession; provided that nothing herein shall require Recipient to produce particular documents or information that constitute attorney-client privilege or attorney work-product (however, Discloser expressly retains the right to challenge any designation of attorney-client privilege or attorney work-product). Any oral Confidential Information will continue to be subject to the terms of this Agreement.
4. Legal Disclosure
In the event that Recipient or its Representatives are requested pursuant to, or required by, applicable law, regulation or legal process to disclose any of the Confidential Information, Recipient will promptly notify Discloser, in writing, so that Discloser may seek a protective order or other appropriate remedy or, in Discloser’s sole discretion, waive compliance with the terms of this Agreement. Recipient will cooperate in Discloser’s efforts to obtain a protective order or other reasonable assurance that confidential treatment will be given to the Confidential Information and the existence of the Transaction or discussions between the Parties relating to the Transaction. In the event that no such protective order or other remedy is obtained, or that Discloser does not waive compliance with the terms of this Agreement, Recipient will furnish only that portion of the Confidential Information which Recipient has a duty as a matter of law to disclose, such determination to be made in good faith reliance on the written advice and direction of Recipient’s legal counsel.
5. Remedies
In the event of a breach or threatened breach by Recipient of the provisions of this Agreement, Recipient agrees that the remedy at law available to Discloser would be inadequate and that Discloser shall be entitled to seek an injunction, without the necessity of posting bond therefore, restraining Recipient from disclosing, in whole or in part, such Confidential Information. Nothing herein shall be construed as prohibiting Discloser from pursuing any other remedies, at law or in equity, in addition to the injunctive relief available under this Agreement, for such breach or threatened breach, including the recovery of consequential and punitive damages from Recipient. In addition, in the event of any violation of this Agreement by Recipient or its Representatives, Recipient shall reimburse the Discloser and its affiliates for all costs and expenses, including reasonable attorneys’ fees, incurred in order to enforce the provisions of this Agreement or exercise any remedies for a violation thereof.
6. Waiver
Recipient agrees that no failure or delay by Discloser in exercising any right, power or privilege hereunder will operate as a waiver thereof, nor will any single or partial exercise thereof preclude any other or further exercise thereof of the exercise of any right power or privilege hereunder.
7. Binding Agreement and Assignment
This Agreement shall be binding upon Recipient, its Representatives, its personal representatives, successors and assigns, and shall run to the benefit of Discloser and its affiliates, successors and assigns. This Agreement is not assignable by Recipient, and any attempted assignment by Recipient shall constitute a material breach by such party.
8. Severability
If any portion of this Agreement is held to be invalid or unenforceable for any reason, it is agreed that said invalidity or unenforceability shall not affect the other portions of this Agreement and that the remaining covenants, terms and conditions or valid portions thereof shall remain in full force and effect and any court of competent jurisdiction may so modify the objectionable provision as to make it valid, reasonable and enforceable.
9. Notice
Any notice or communication required or permitted to be given by any provision of this Agreement shall be deemed to have been effectively given and received on the date personally delivered to the party to whom it is directed or when deposited by registered or certified mail, with postage prepaid, and addressed as set forth on the signature page hereof. Either party may change its notice address by delivering a written change of address to the other party in the manner set forth in this paragraph.
10. Agency Disclosure
Broker as Single Agent or Transaction Agent. Broker has been retained by owner of the Property in the capacity of:
☐ Single Agent for Owner/Seller ⌧; Transaction Broker
For purposes of this agreement, a “Single Agent” means a broker who represents, as a fiduciary, either the purchaser (or lessee, as appropriate) or seller (or lessor, as appropriate) but not both in the same transaction.
For purposes of this agreement, a “Transaction Broker” means a broker who provides limited representation to a purchaser (or lessee, as appropriate), and seller (or lessor, as appropriate), or both, in a real estate transaction, but does not represent either in a fiduciary capacity or as a single agent. In a transaction broker relationship, a purchaser (or lessee, as appropriate) or seller (or lessor, as appropriate) is not responsible for the acts of a licensee. Additionally, the parties to a real estate transaction are giving up their rights to the undivided loyalty of a licensee. This aspect of limited representation allows a licensee to facilitate a real estate transaction by assisting both the purchaser and the seller, but a licensee will not work to represent one party to the detriment of the other party when acting as a transaction broker to both parties.
11. Applicable Law
This Agreement shall be governed by and construed in accordance with the laws of the State of Florida, without giving effect to the principles of conflict of laws thereof. Any action to enforce or construe the terms of this Agreement shall be brought in a state or federal court of competent jurisdiction in Florida.
12. Entire Agreement
This Agreement constitutes the entire agreement between the parties hereto with respect to the subject matter of this Agreement and supersedes and is in full substitution of any and all prior agreements and understandings whether written or oral between the parties relating to the subject matter of this Agreement. No modification, amendments or waiver of the terms and conditions hereof shall be binding upon Discloser, unless approved in writing by Discloser.
This Agreement may be executed in counterparts, each of which shall constitute an original, but all of which shall constitute one agreement. This Agreement may be executed by facsimile and PDF copy signature or other electronic means, which shall be accepted as if they were original execution signatures.
The following information from your profile will be used in the agreement:
Process. Execution. Results.